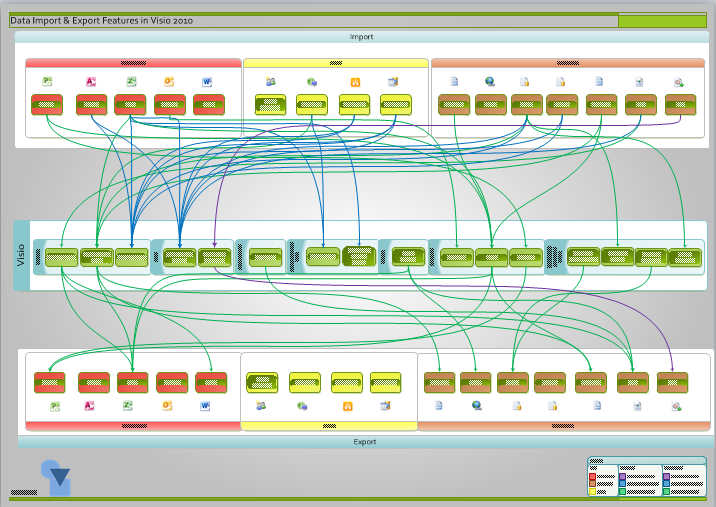
I have been using (Microsoft) Visio for importing and exporting data since 1996, and was an early tester/adopter of the Database Wizard features in Visio 4.1 (I think). I think of Visio as a data visualization tool, yet I cannot recall seeing a comprehensive list of the areas in Visio, out-of-the-box, where you can import and export data easily. So I decided to draw a data-linked diagram of just this for Visio 2010.
I have made the files available for you at the following links:
- Visio file : https://1drv.ms/x/s!AqkzN8kb1lAz5EURpWctPZlFsCwl?e=PKVa0a
- Excel workbook : https://1drv.ms/x/s!AqkzN8kb1lAz5EURpWctPZlFsCwl?e=PKVa0a
- Saved as Web version : https://1drv.ms/u/s!AqkzN8kb1lAz5EnqDG1VP9MYf5Gm?e=PlMyxe
- PDF version : https://1drv.ms/b/s!AqkzN8kb1lAz5ENiBi4SLIfc7r69?e=l23H1y
- XPS version : https://1drv.ms/u/s!AqkzN8kb1lAz5ES1YX5Cr-7gUiWz?e=BagMPW
I built the diagram on data that I entered into an Excel workbook, although I soon realised that I could have perhaps done this better in Access or SQL Server!
I decided to split the data sources and targets into three different (product) types:
- Desktop App
- Server
- File Format
Each of the data sources and targets are automatically color-coded, using Data Graphics, according to their type:

There is a legend at the bottom of the diagram too:
The source types of import data to Visio are arranged across the top of the diagram, and the target types of export data from Visio are arranged along the bottom.
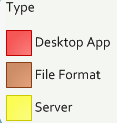
The features in Visio that utilize data are grouped by their category across the middle of the diagram:
- Business
- Data
- File / Save As
- Maps and Floor Plans
- Review
- Schedule
- View / Add-Ons / Visio Extras
Each of the Visio feature boxes contain a hyperlink that explains it in more detail.
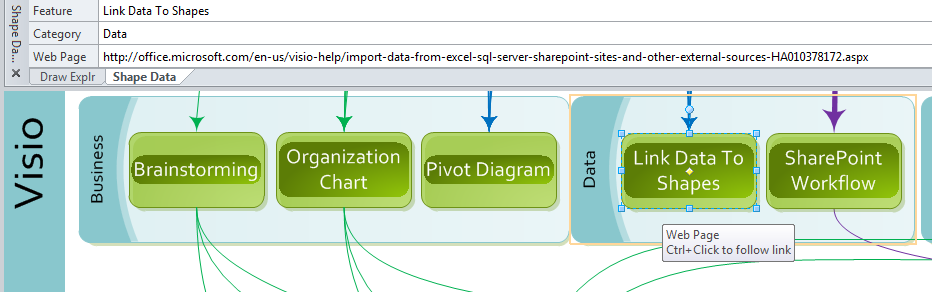
The connectors between the data and the Visio feature are automatically color-coded too, according to the lowest edition of Visio where the feature is available.
Hopefully, you already realize that the Professional edition has all of Visio Standard, plus extra stuff. Similarly, Premium has all of Professional, and then adds more stuff, such as Visio Services and Data Validation.

What my diagram reveals is there are far more import data features than export data. This is a pity, but data updates should be done with caution, and perhaps should be identity controlled. For example, the Link Data to Shapes feature is only one way, though there are a few of us who use the connection information to create a two-way link in code.
I also used the Review / Shape Reports feature to export the relevant data to a table:
One pattern that I often need to use is consuming data from web services, and I would like to see this added to the next version of Visio, rather than having to always write the code myself.
Another common pattern that I would like to see is the automatic connection between shapes using a nominated data-linked connector … an extension to Link Data to Shapes. Whilst I am creating this wish list, I would also like to see the automatic placement of data-linked shapes into data-linked containers. Both of these wishes were achieved manually in the attached diagram.
Hi,
I am having issue with Visio while using the hyperlink when i generate the web page of the Visio file.
I am using BPMN diagram in Visio 2010 & have 5 different Visio files, each having about 30+ processes documented.
For illustration only:
Let’s say, I have created 4 files:
1st File “Plan”: which has following collapsed sub-processes: A–> B –> C?
2nd File “Planning Activities – A”: which has following tasks: A1–> A2–>A3
3rd File “Planning Activities – B”: which has following tasks: B1–> B2–>B3?
4th File “Planning Activities – C”: which has following tasks: C1–> C2–>C3?
I have linked collapsed sub-process “A” within 1st file with the sub-process worksheet saved in 2nd file to give a blown-up view of expanded sub-process “A”. Similarly I have done it for collapsed sub-process “B” as well as collapsed sub-process “C” in 1st file i.e. linked each to its blown-up view in other Visio 2010 file.
Since 1st file is the parent file, I am trying to save that as web page (*.html).
When i open the saved web page and click on the collapsed sub-process “A” it opens the Visio file for “Planning Activities – A”, instead it showing it on HTML so that I can view A1 on html and then navigate back to A-> B-> C diagram.
Ideally, when I save as the parent file in html format, data from the entire downstream Visio file should also be saved as html content with configured hyperlinks.
Appreciate if you can suggest a work around.
Regards
Rahul Gupta
link to excel not working?
Sorry, I got the file extension wrong… fixed now.
link to excel STILL not working
it SHOULD be working now …
hi,
I am trying to create a diagram like the one you have shown as an example here. Could you post some helpful information on how you were able to create the diagram above? I am trying to work at it using the ‘link data to shapes’ feature and need to link to data from excel.
Can you please help me out??I have tried to find steps to work it out everywhere online with no luck.
Many thanks.
Hi,
Could you please post snapshots or instructions on how you created the above diagram ?
Any link where we could refer it would also be very useful.
It would be very helpful.
Thank you.
Hopefully my other response will help?
hi
I had one question based on the example you have worked out in your post.
The visio diagram has 2 sheets:”To Product Links” and “From Product Links” while the excel provided has only 1 consolidated Product Link sheet.
Could you tell me if you were able to sort out the sheet in visio itself (if so how??) or is it a different sheet you used while creating the visio diagram?
Thank you
I used the ProductLinks sheet as the source for both DataRecordsets, but used different filters in the Rows to Include / Select Rows… dialog.. I used a (custom) filter on the From Product and To Product fields, where they Contain the word Visio.
You can examine the query that I used with the Immediate window … the lines that start with a ? are the commands I typed in, and the following line is the response:
?Visio.ActiveDocument.DataRecordsets(4).Name
From Product Links
?Visio.ActiveDocument.DataRecordsets(3.Name
To Product Links
?Visio.ActiveDocument.DataRecordsets(4).CommandString
select * from `Product Links$` WHERE `From Product` LIKE ‘%Visio%’
?Visio.ActiveDocument.DataRecordsets(3).CommandString
select * from `Product Links$` WHERE `To Product` LIKE ‘%Visio%’
Hi David,
Thank you for so much for the detailed information. This was the a very helpful blog with data I was searching for from a long time.
I had one more question. I was trying to leverage the Web Drawing feature after creating my Visio Diagram by linking it to data from excel.
Could you explain how we can publish the web drawing on shared sites like sharepoint?
Can we do it in anyway without having the visio services enabled?
Please let me know.
Thank you again.
Visio Services gives you the ability to have a Visio drawing to be apparently updated when it is viewed in the Visio Web Drawing Share Point web part.
These updates are restricted to Shape Data values and linked Data Graphics, it does not include addition, deletion or movement of any shapes.
If you do not have Visio Services enabled then the Visio document will need to be opened in Visio to be refreshed before saving back to SharePoint (or re-publishing to any where else).
Of course, if the refresh requires adds, deletes or moves then you would need to have the Visio drawing refreshed in Visio anyway.
I’m trying to create a diagram which can update when the data is updated ie, the size of the shapes and color when the $amount is updated.
Can you please help
Firstly, you can use DataGraphics to change the color, if you want, or you can use the ShapeSheet to chnage the Color and the Size
If you have an Ellipse shape, then open the ShapeSheet (tick File / Options / Advanced / Developer Mode)
Let’s say you have a Shape Data row called Prop.Amount, with a default value of 0, and you want the shape to have a minimum width of 4 mm, then enter the following formula in Width
=GUARD(4 mm + (Prop.Amount * 0.1 mm))
and in Height:
=GUARD(Width)
You can even make the Circle grow logrithmically, if a pure scalar growth is too much:
=GUARD(4 mm+LOG10((Prop.Amount*1 mm)))
You will now have a circle that grows and shrinks according to the Prop.Amount value.
Similarly, you can have fun with the Color…
Actually there are two Color cells, FillForegnd and FillBkgnd, and the FillPattern value controls which one is most dominant.
If FillPattern = 1 (Solid), then only FillForegnd is shown, and Color can be expressed as RGB(n,n,n) where n is any number between 0 to 255.
Therefore you could have a formula that plays with these numbers …
For example, the following formula for FillForegnd would change the color from Red at $0 to Green at $1,000,000, going through all shades in between:
=GUARD(RGB((255-INT((Prop.Amount/1000000)*255)),INT((Prop.Amount/1000000)*255),0))
You would usually edit the Master shape to do this…
Check out this old reference, it’s still useful : http://msdn.microsoft.com/en-us/library/aa245244(v=office.10).aspx
This is excellent. In playing around I tried to change in the ShapeSheet for a Product stencil object from Hyperlink_VisDM_Comparison>Description to the User.visEquivTitle. I saved it as a new Master stencil. No matter how many ways I’ve tried this when I link new data to the new Product object it reverts back to the description ‘Comparison.’ I’m guessing this is something to do with SETATREF behavior which is new to me. Even when i create a new master it will always revert back. Can you comment?
Thanks again.
Have you tried http://www.microsoft.com/download/en/details.aspx?displaylang=en&id=16086 ?
Hi,
I simply want to import source code into Visio Professional 2010 and create UML diagrams with it. From what I’m finding, it is either not possible, or very difficult. Is that the case, or have I missed something?
Do you get Project / Visio UML / Reverse Engineer option in Visual Studio 2010 ?
David,
I am very very green at visio and want to use this functionality linked to an access database.
However I want to be able to automatically change connector start and end points when i change data in the data base. You had done something like this with org charts. Is there a clear detailed explanation on how to dynamically derive shapes and links for data in an access database?
Jim,
Ah … I have been asking Microsoft to provide such functionality out-of-the-box. We used to have a Flow Chart Wizard and a Network Diagram Wizard that could create connected diagrams …
I usually have an External Recordset that contains the from and to connections. I will look to see if I can generalise the code over the next few days….
Thank you appreciate any help you can give the newbie….
David,
If I get it right you’ve used an Excel as source for this amazing visio. Where can I find it? With the link above I get a zip with several xml but no xlsx…
I’m trying to define shapes and links outside visio and to generate a simple flowchart – like it was possible in earlier versions with csv.
Can you help me?
I have listed the link to the Excel file in the blog : http://www.visualizinginformation.com/blog/OfficeProductLinks.xlsx
Regarding automatically connecting shapes together from data: I too remember the old Network Diagram and Flow Chart Import Wizards that enabled connections to be created automatically from files. Sadly, we no longer have a similar feature, but I often have to automate this task. My approach is almost always the same, which is to use Link Data to Shapes to create linked external data recordsets. Then I write code to use this data to create connections. I have done this in my post at http://davidjpp.wordpress.com/2009/02/24/creating-an-org-chart-without-the-org-chart-wizard/ , for example.
David,
I use visio to make network diagrams, I searched the internet if it’s possible to export data to excel, for easy editing and then to import that data back to the drawing.
I hope you can tell me if this is possible and were i can find it.
The old Database Wizard stuff in Visio does allow two way communication with Excel, but it has some problems as it is based on the old ODBC toolkit.
The newer Link Data to Shapes only reads from Excel.
You can use the Shape Report feature to export data to Excel but the resultant worksheet is unlikely to be in the same format that you originally used to import using Link Data to Shapes. However, yu could feasibly write some code to reconcile the two.
Another option is to write code to read the data recordset and connection settings used for Link Data to Shapes, and then modify it to become a writable link back to Excel. I have recently done this for a client, so it can be done.
I’m not familiar to writing code and i have got hundreds of drawings. Have you got an example for me. But If i read your explanation i think that it needs a lot of time.
Hi David,
A very nice presentation of the feature set!
I am having the problem in Visio 2010 that a background of a shape of the object itself is not able to be externally referenced, Is this option present in Visio 2013 html exports today?
Here is a less cryptic and very simplified example; if the rectangle does not work, see it as an image itself.
You have a visio file with 1 rectangle, the backround of the rectangle should be a image.jpg that is frequently (1 second) updated on the host server.
by adding a refresh line in visio´s html code I was able to refresh the page but the problem is that I am not able to reference the image.jpg to the external location.
Visio seems to export this image.jpg in its own format.
Have you got experience with this or do you have any thoughts?
br
jp
Hmm … it is not that Visio saves the png into a different format, it is that you cannot get at the particular image to refresh it directly.
Perhaps you should look at injecting your own JavaScript functions into the exported html files?
If your rectangle has any Shape Data or hyperlinks, then the export to html should create an image map or similar (depending on the output format you choose).
There are JavaScript functions in the export to use these shapes in the search or mouse over vents, for example.
Check out John Goldsmith’s blog at
Hi David.
Will it be possible to take the data from a Visio 2010 Gantt Chart , ID, Tasks, Start and Finish to a relational database. I see you have mentioned that text files can be generated. I would like to use the info from the Gantt chart to create a table in a database.
Appreciate the advice
All the Task Bar shapes have Shape Data, so you can use the Review \ Shape Reports task to export to Excel.
The Dependencies\Link Lines would require some code to extract the connections
How to download selected callflows in to excel sheet in visio?
i know we have shape reports option,but my issue is we cant download selected callflow pages
the only options available are current pages and all pages.
let me know if there is some thing else that might help me out.
I amnot sure if I understand your question, but does this help : http://blog.bvisual.net/2009/09/16/listing-connections-in-visio-2010/
can I export visio symbols properties to csv file?
You can export to Excel, and from there save as csv
HI, Is this visio/excel file still available for download. I like what I see, but unable to download and not sure what is the problem. Thx
Now fixed
For what it’s worth, visualizinginformation.com seems to be redirecting to sedoparking.com
Thanks, link (visualizinginformation ) is now working again, with an improved site. All code can be downloaded from the Book Index page.
Your visualizinginformation domain seems to be down, obtw. It’s a great book, still useful.
Thanks, link (visualizinginformation ) is now working again, with an improved site. All code can be downloaded from the Book Index page.
I enjoyed this blog and it was helpful. The links above go to http://visiorules.com/visinfo/ instead of the files suggested. I would like to see them if you are willing. Thanks. Greg
Hi David,
Thanks for sharing!
I’ve tried to download the files following the link on the top of the page but i’m re-direct to a page that doesn’t contain the files.
thanks again,
Nuno
Should be fixed now.
The (Download All Code.zip) don’t have the Product Links.xxx files
I have fixed those links now.
Hello, i have the problem that:
– i want to insert a number of visio processflows into word,
– add hyperlinks to each specific process,
– being able to use the hyperlinks in Word and PDF
Using Word 2010, Visio 2013 Adobe 11 reader.
The problem i have when i copy straight out of visio is that the word version doesnt let me check the hyperlinks since it opens visio.
The problem i have when i save the visio object as .wms, than import it as an image and finally edit the image is that the hyperlinks can work in word, however not in adobe. However other hyperlinks in that same file do work.
I am not sure I understand totally. Are you using Copy & Paste in Word, or Insert Object From File? Do you have a single hyperlink per Visio shape?
Hi David, I am trying to create a pivot diagram with the org chart structure, but it does not display the hierarchy. Are you able to help me with that?
to be more especific, I need the sales summarized by manager, then rollup to VP, rolledup to Director and have the total also for the president. Is this feasible?
I will soon have an article on Pivot Diagrams coming out on http://blog.orbussoftware.com/category/microsoft-visio/ , though I think your requirement is a little different and more like the summaries that I created in my first book : http://visiorules.com/visinfo/chapter.cshtml/3
Do you have any examples or tips on generating Event-driven process maps from Excel data? I’m build “use cases” and have processes in mind, but I’m not familiar with setting up a UML diagram, and I don’t think they want that anyway. EPC seems more “shiny”, which plays better for our customer. Any help you can provide is greatly appreciated.
My new book contains code examples for creating diagrams from data.
Hello,
Your links are dead. Would be so kind to upload it or do you have other places where we can download it again?
Best regards
Hmm, sorry. Microsoft changed the personal OneDrive links protocol … I have updated the links now