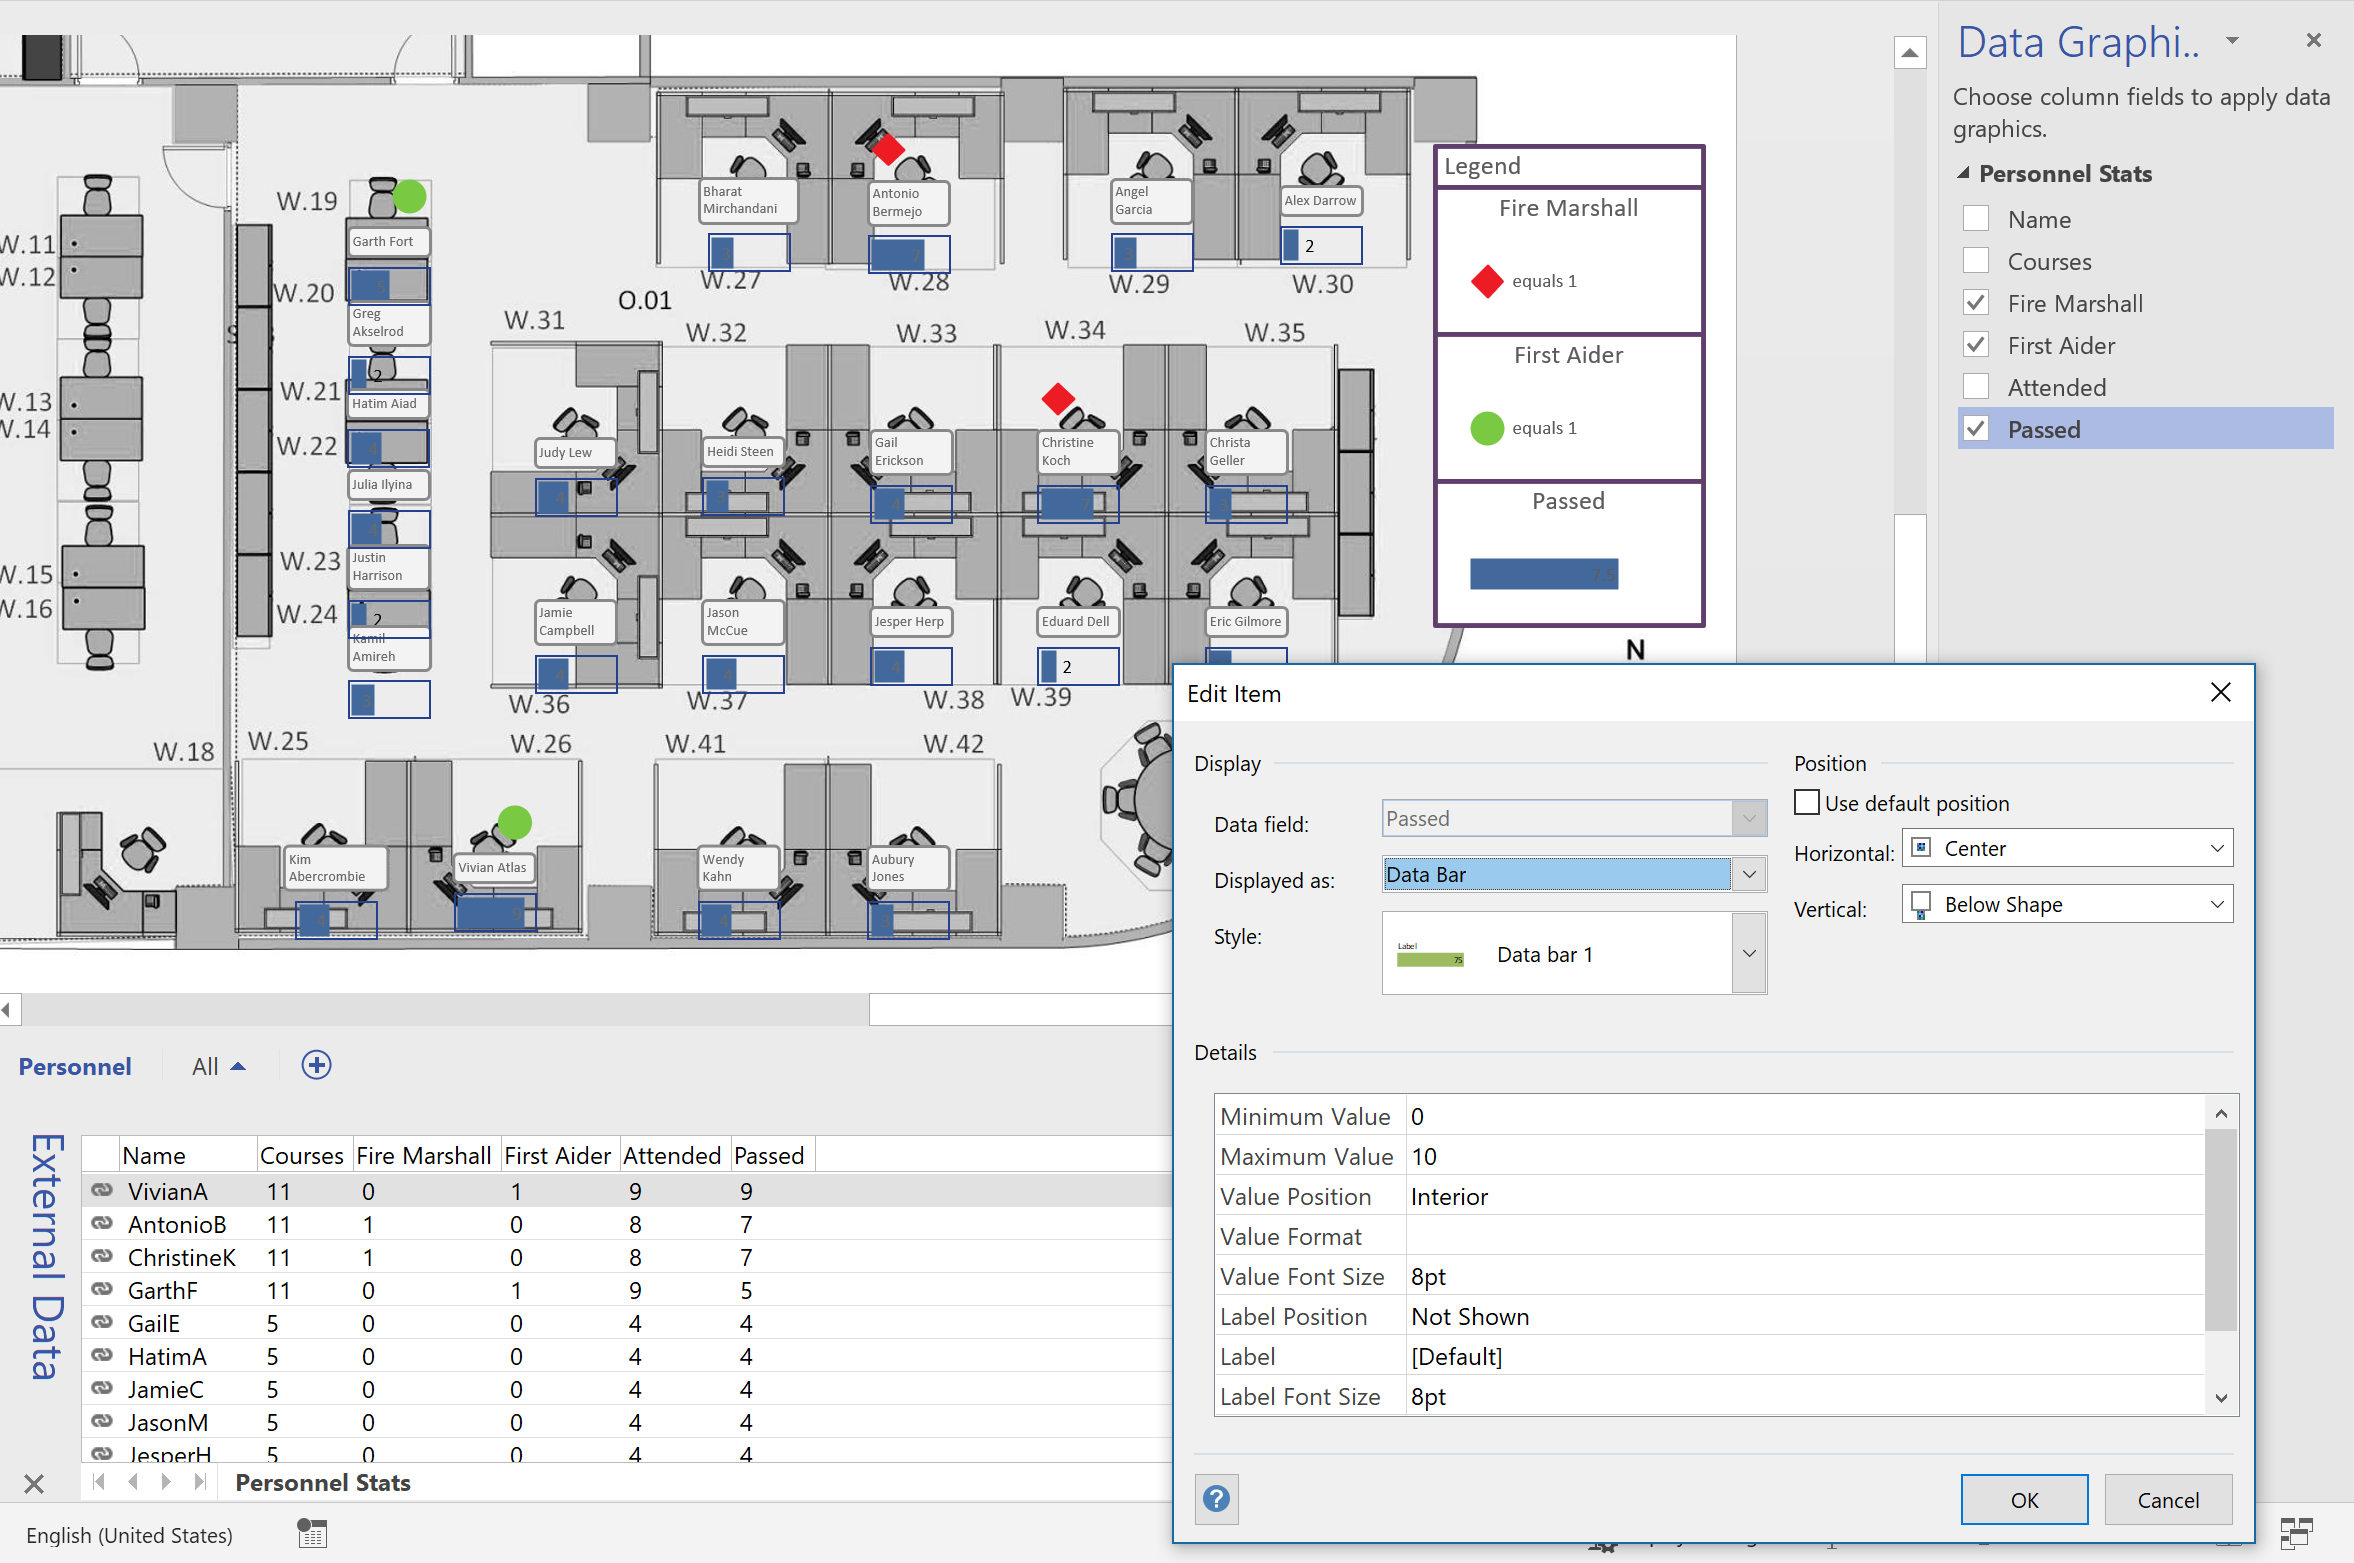
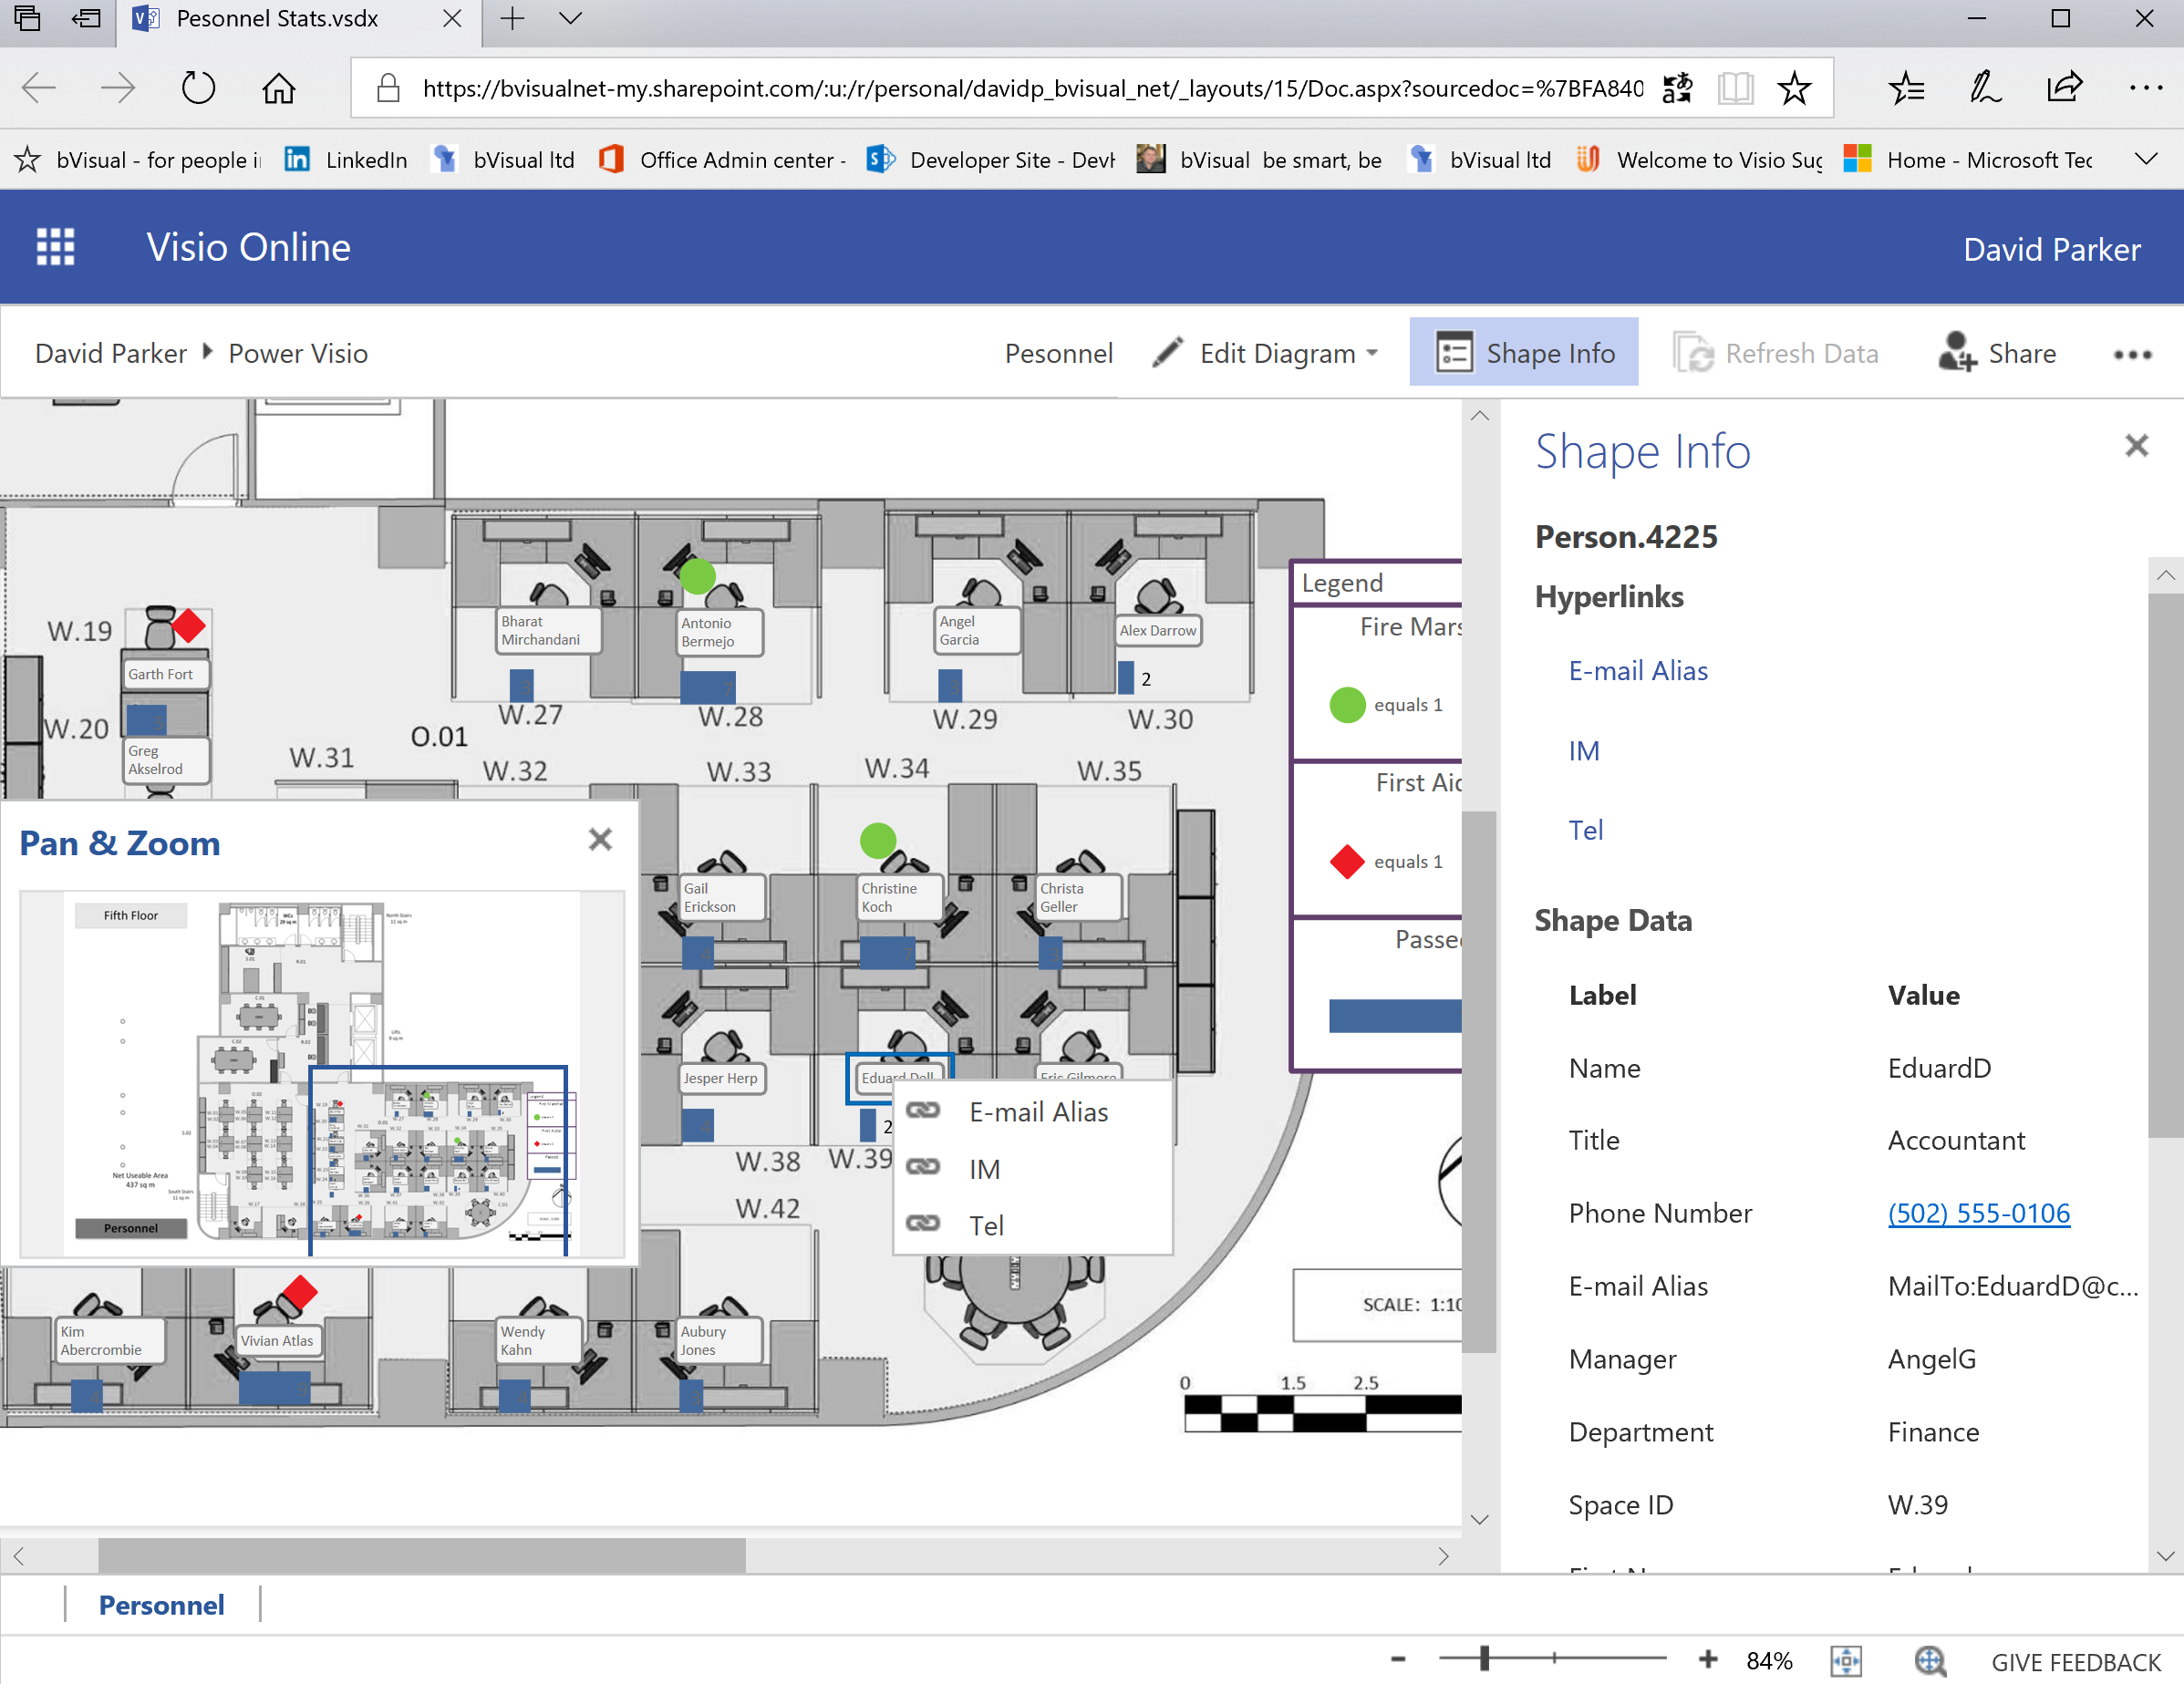
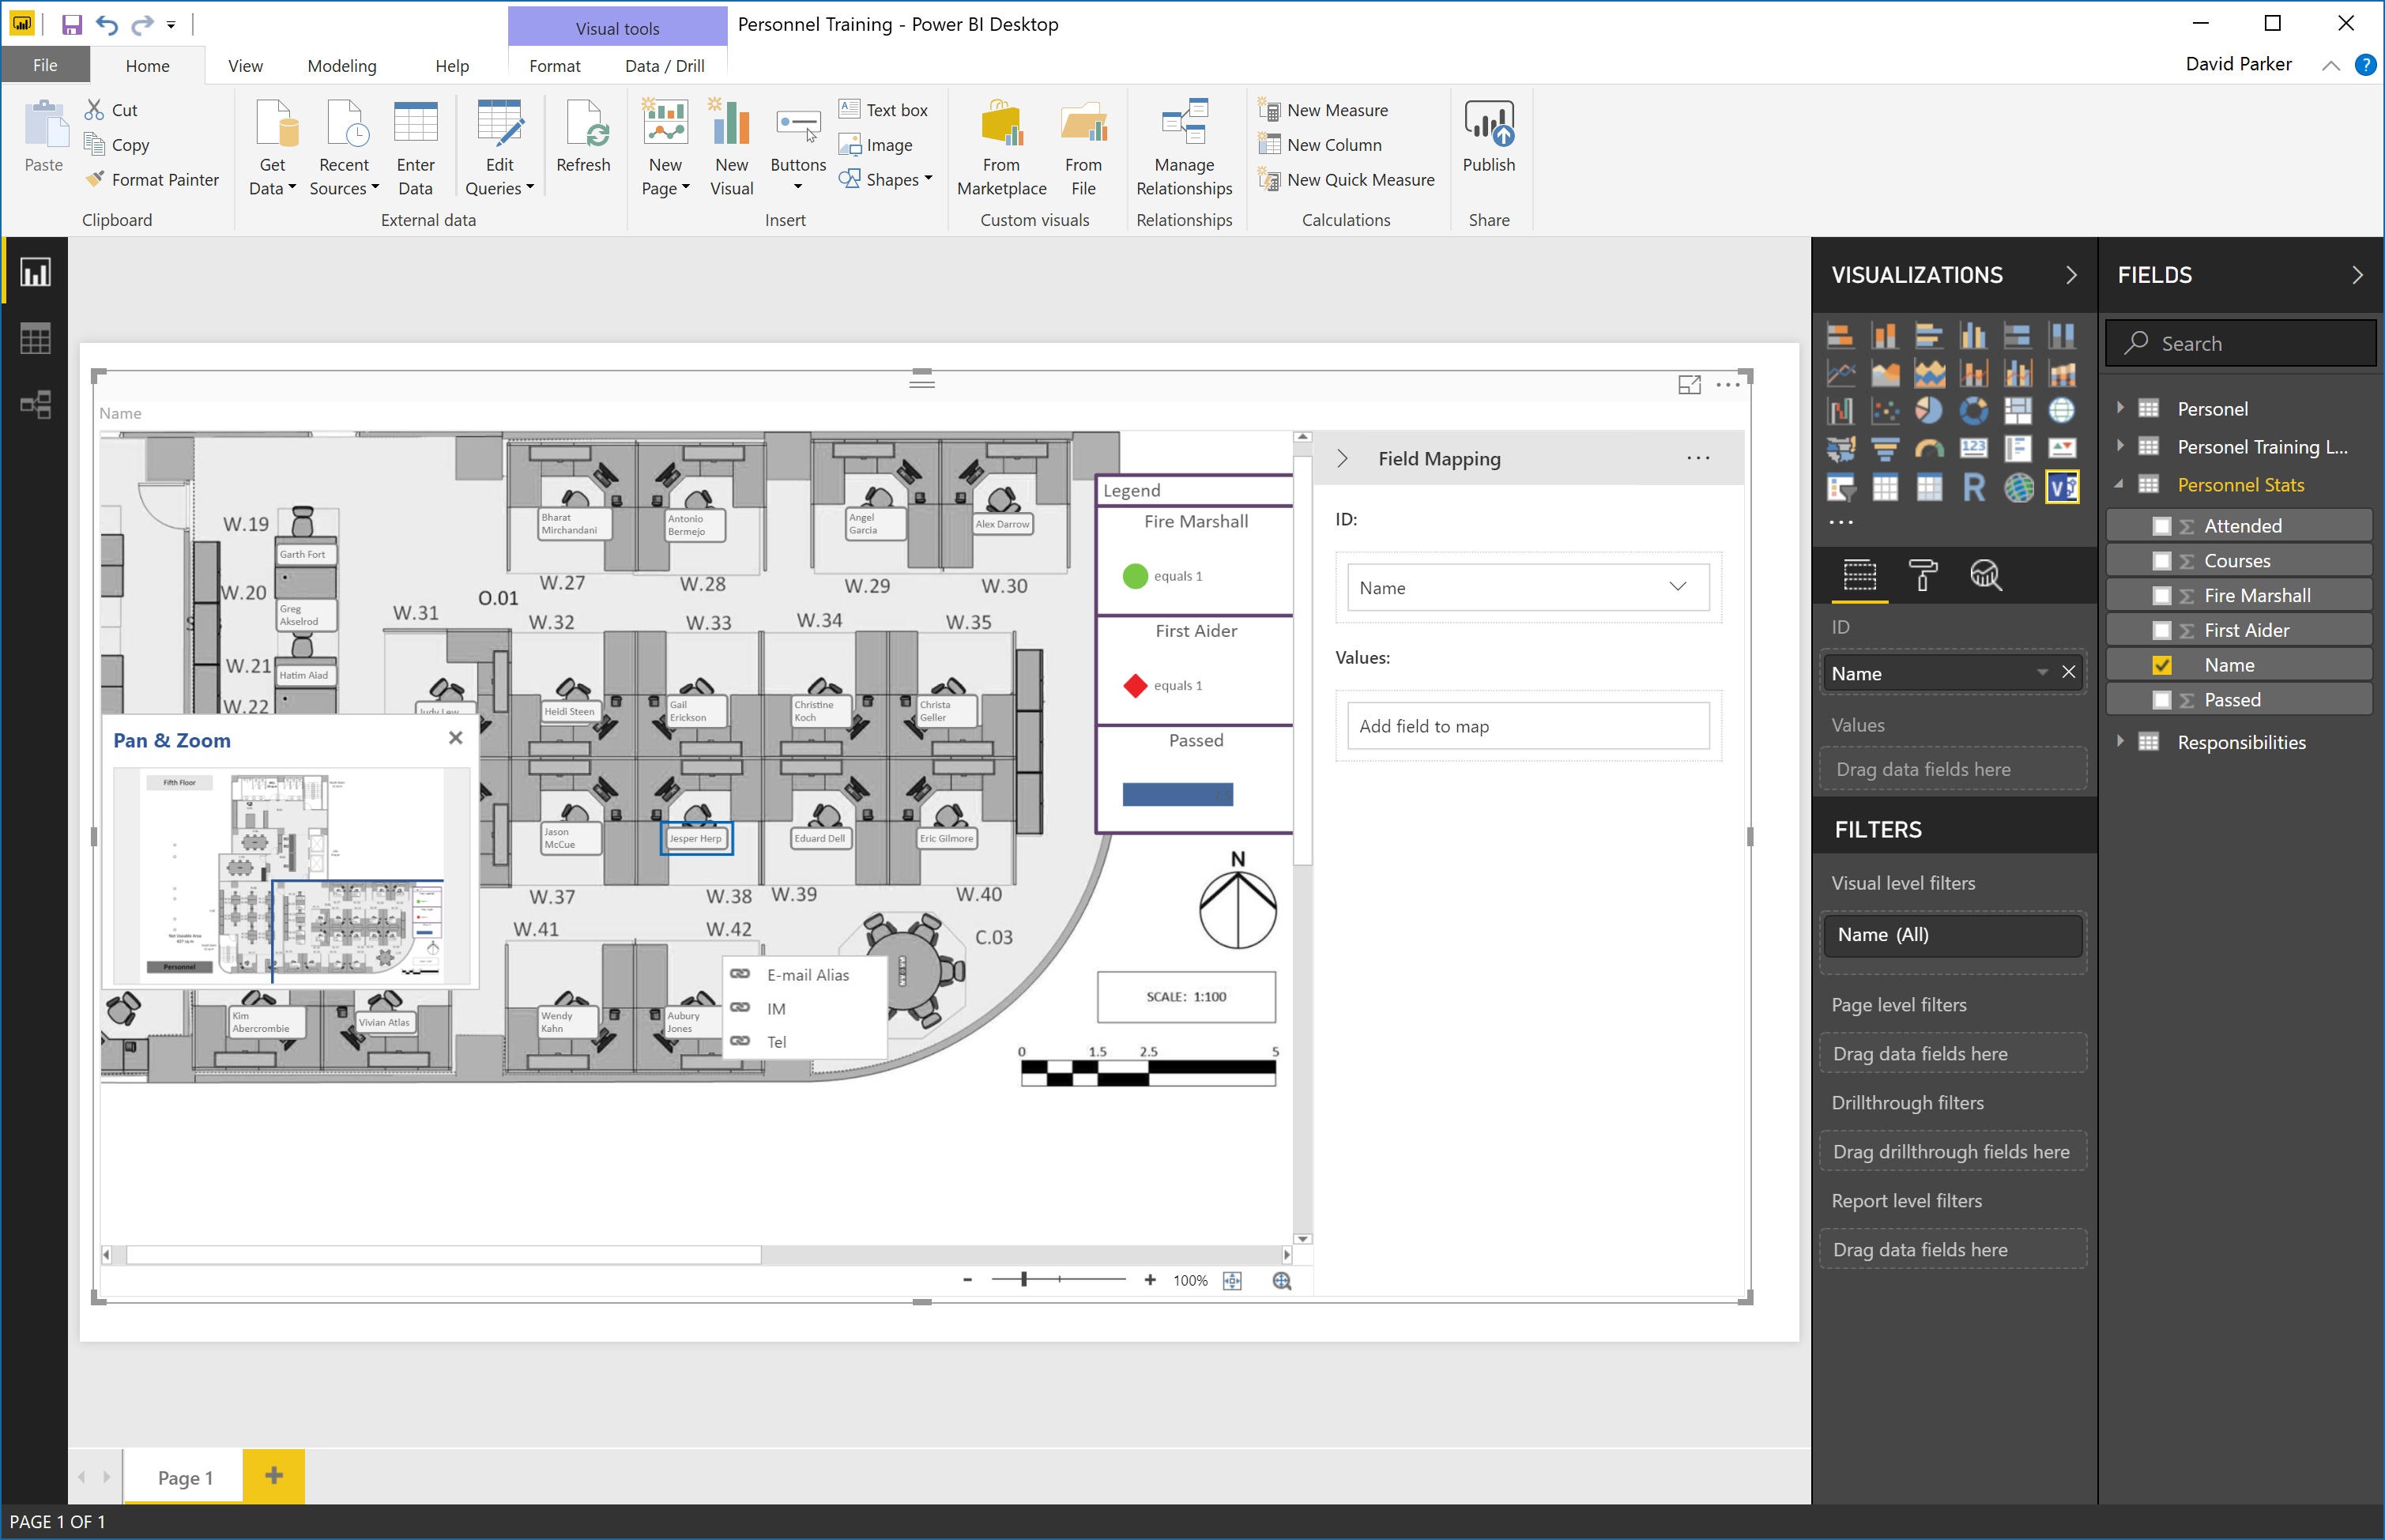
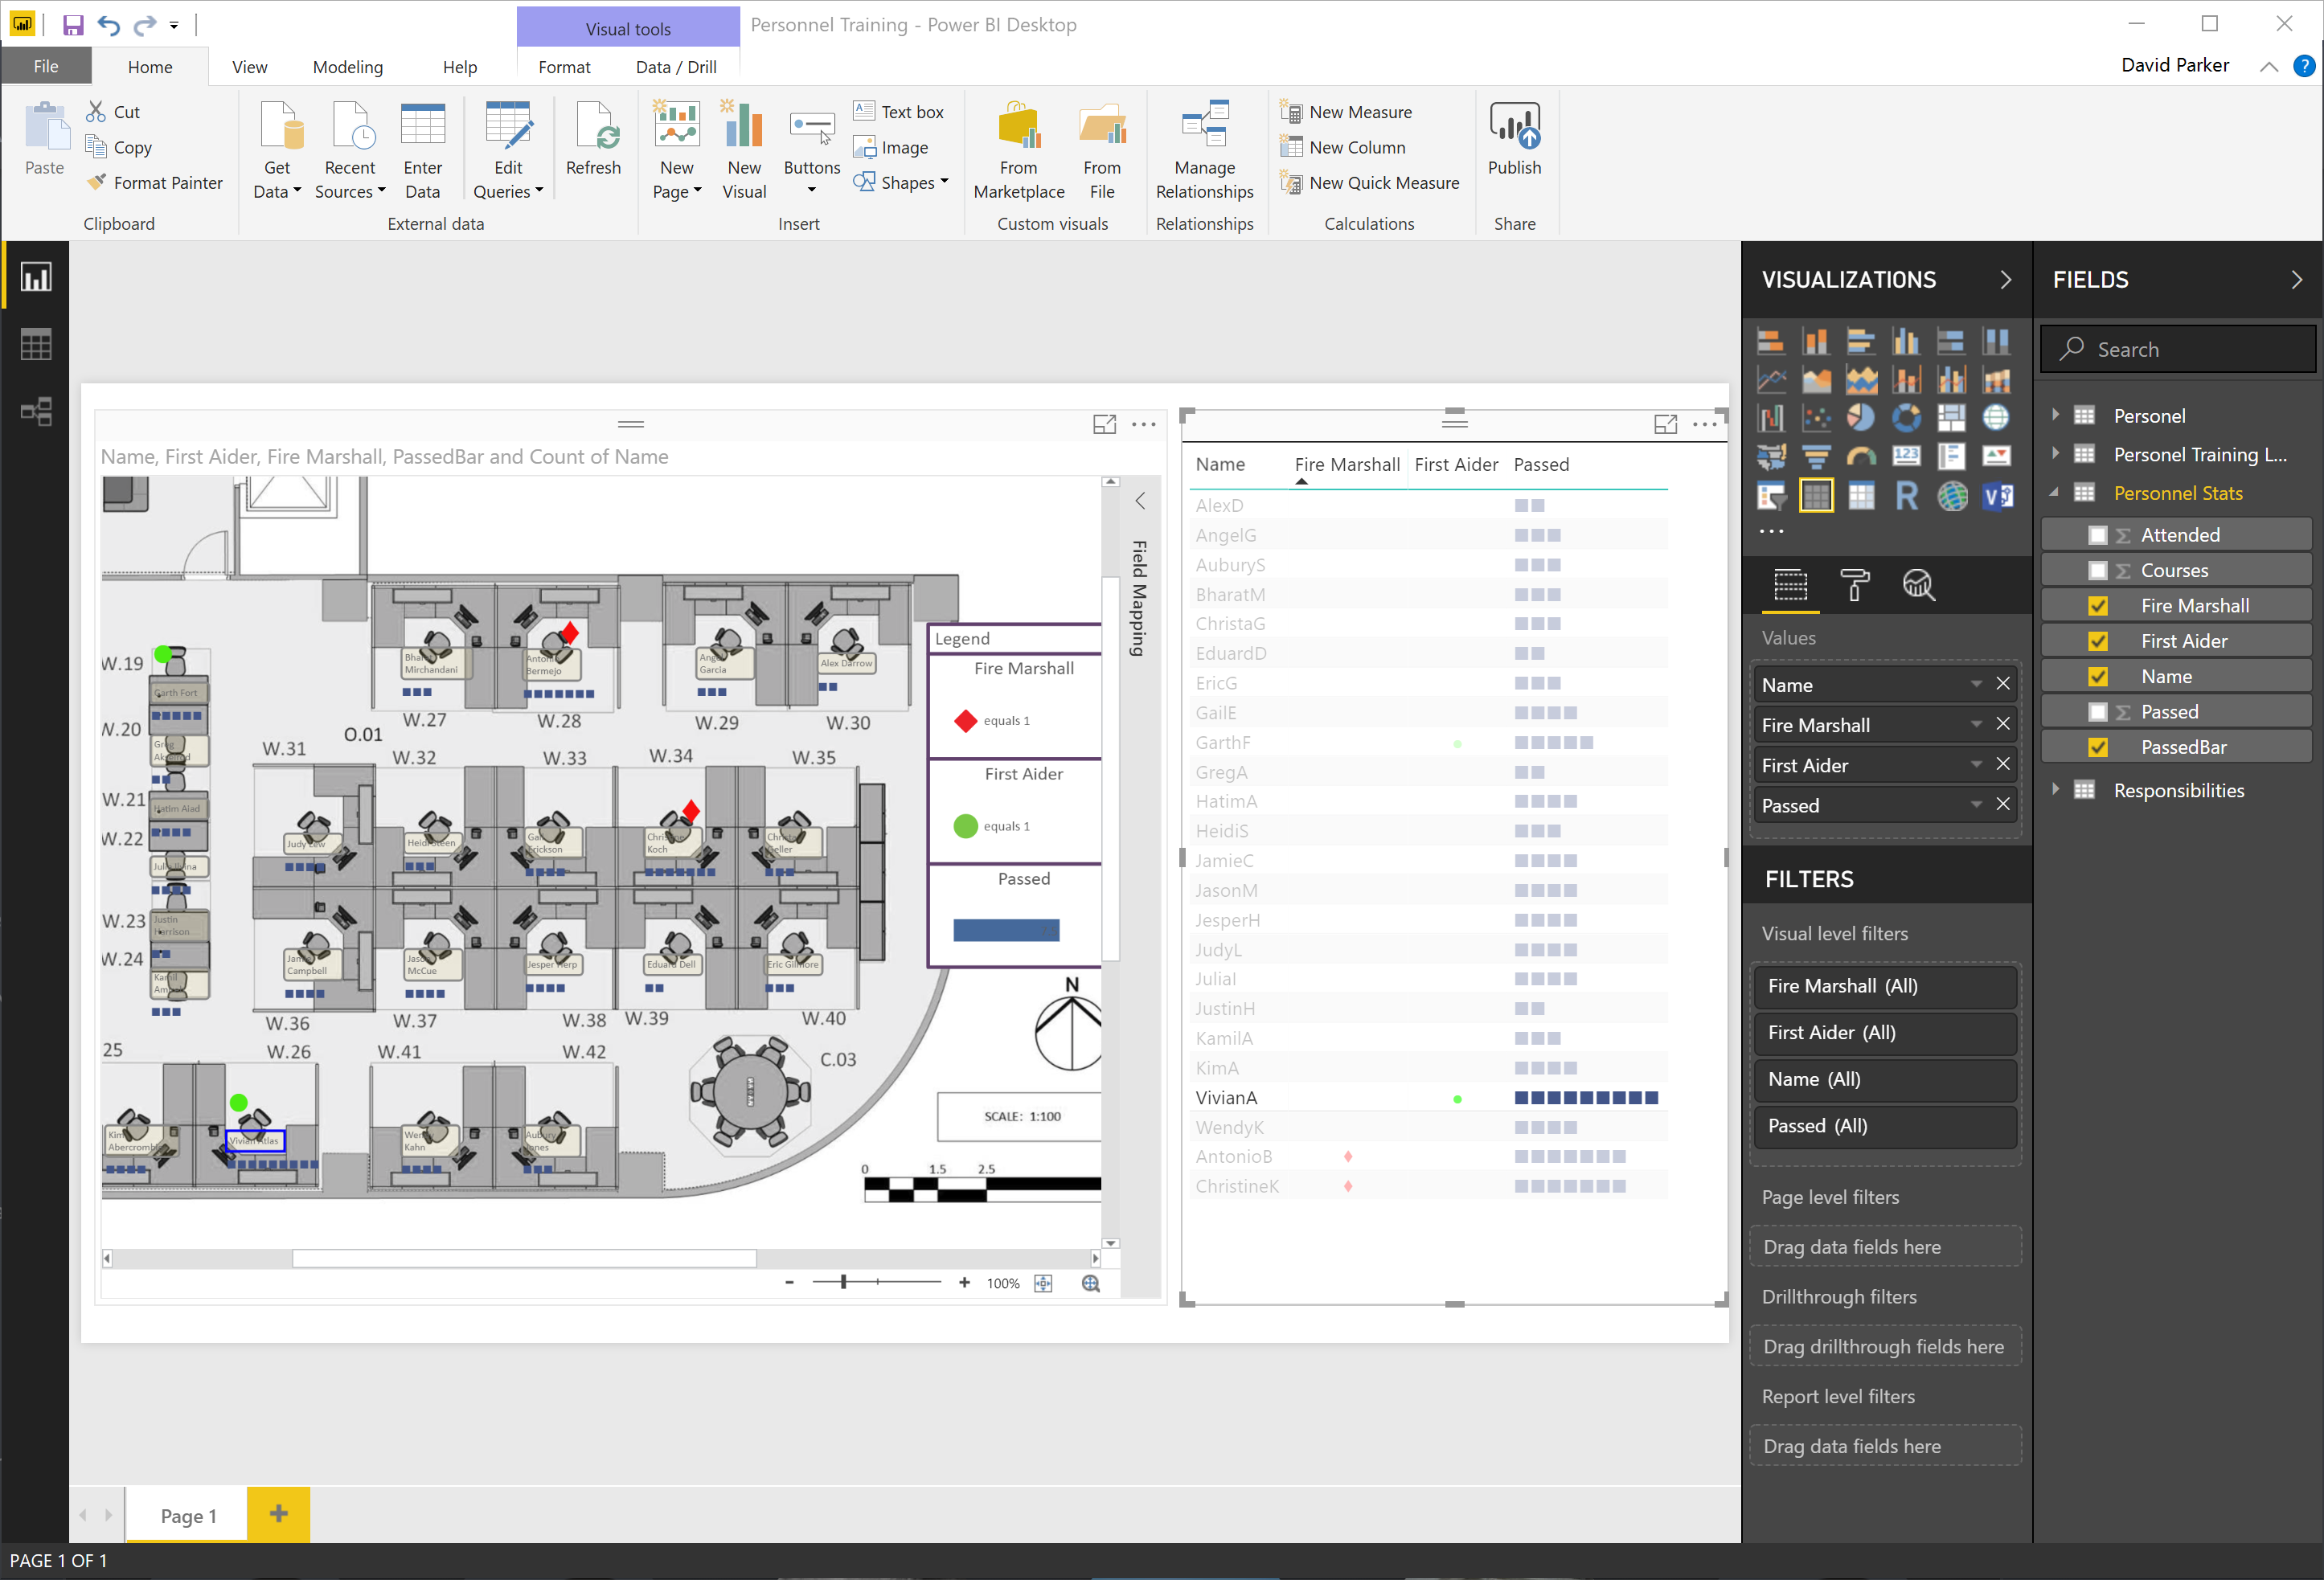
I really enjoy linking data to Visio diagrams, either directly or using the Visio custom visual in Power BI. This visual has the ability to display PowerQuery data as text or color, but not as icons or data bars. These last two features are something that can be used natively in Visio, and automatically updated in Visio Online. I have previously urged Microsoft to add these abilities to the Visio custom visual in Power BI, but there is no sign of it appearing just yet. The custom visual actually removes any Data Graphics ( Text Callouts, Icon Sets, Data Bars or Color by Value) that may already exist in a Visio diagram when it is embedded into Power BI. This reduces the number of shapes in the visual (there is currently a low limit) and, in any case, the data should be displayed from Power BI.
I want to be able to display some data as icons and data bars within the Visio diagram, so what is the alternative? Fortunately, there is a way using text symbol characters and the wonderful Power Query formulas!
Archives for April 2018
Swapping Images in a Visio Shape
I often include images in Visio diagrams, and sometimes they are part of a group shape. There are times when I need to swap the image for another, and I want the correct width to height ratio for the new image to be applied, otherwise the image will be distorted. I recently realised that the Shape.ChangePicture() function in Visio actually returns this ratio which can then be applied to the shape cells so that the image is not distorted. Therefore I wrote some C# code (in LinqPad) to utilize this method to provide the option to change the image in a selected shape or sub-shape.
So, I wrote this function in C# to swap the image of the shape, and to apply the formulas to maintain its correct aspect ratio, even if the shape is subsequently resized.
Using Visio with SQL Server Graph Databases – April 2018 Update
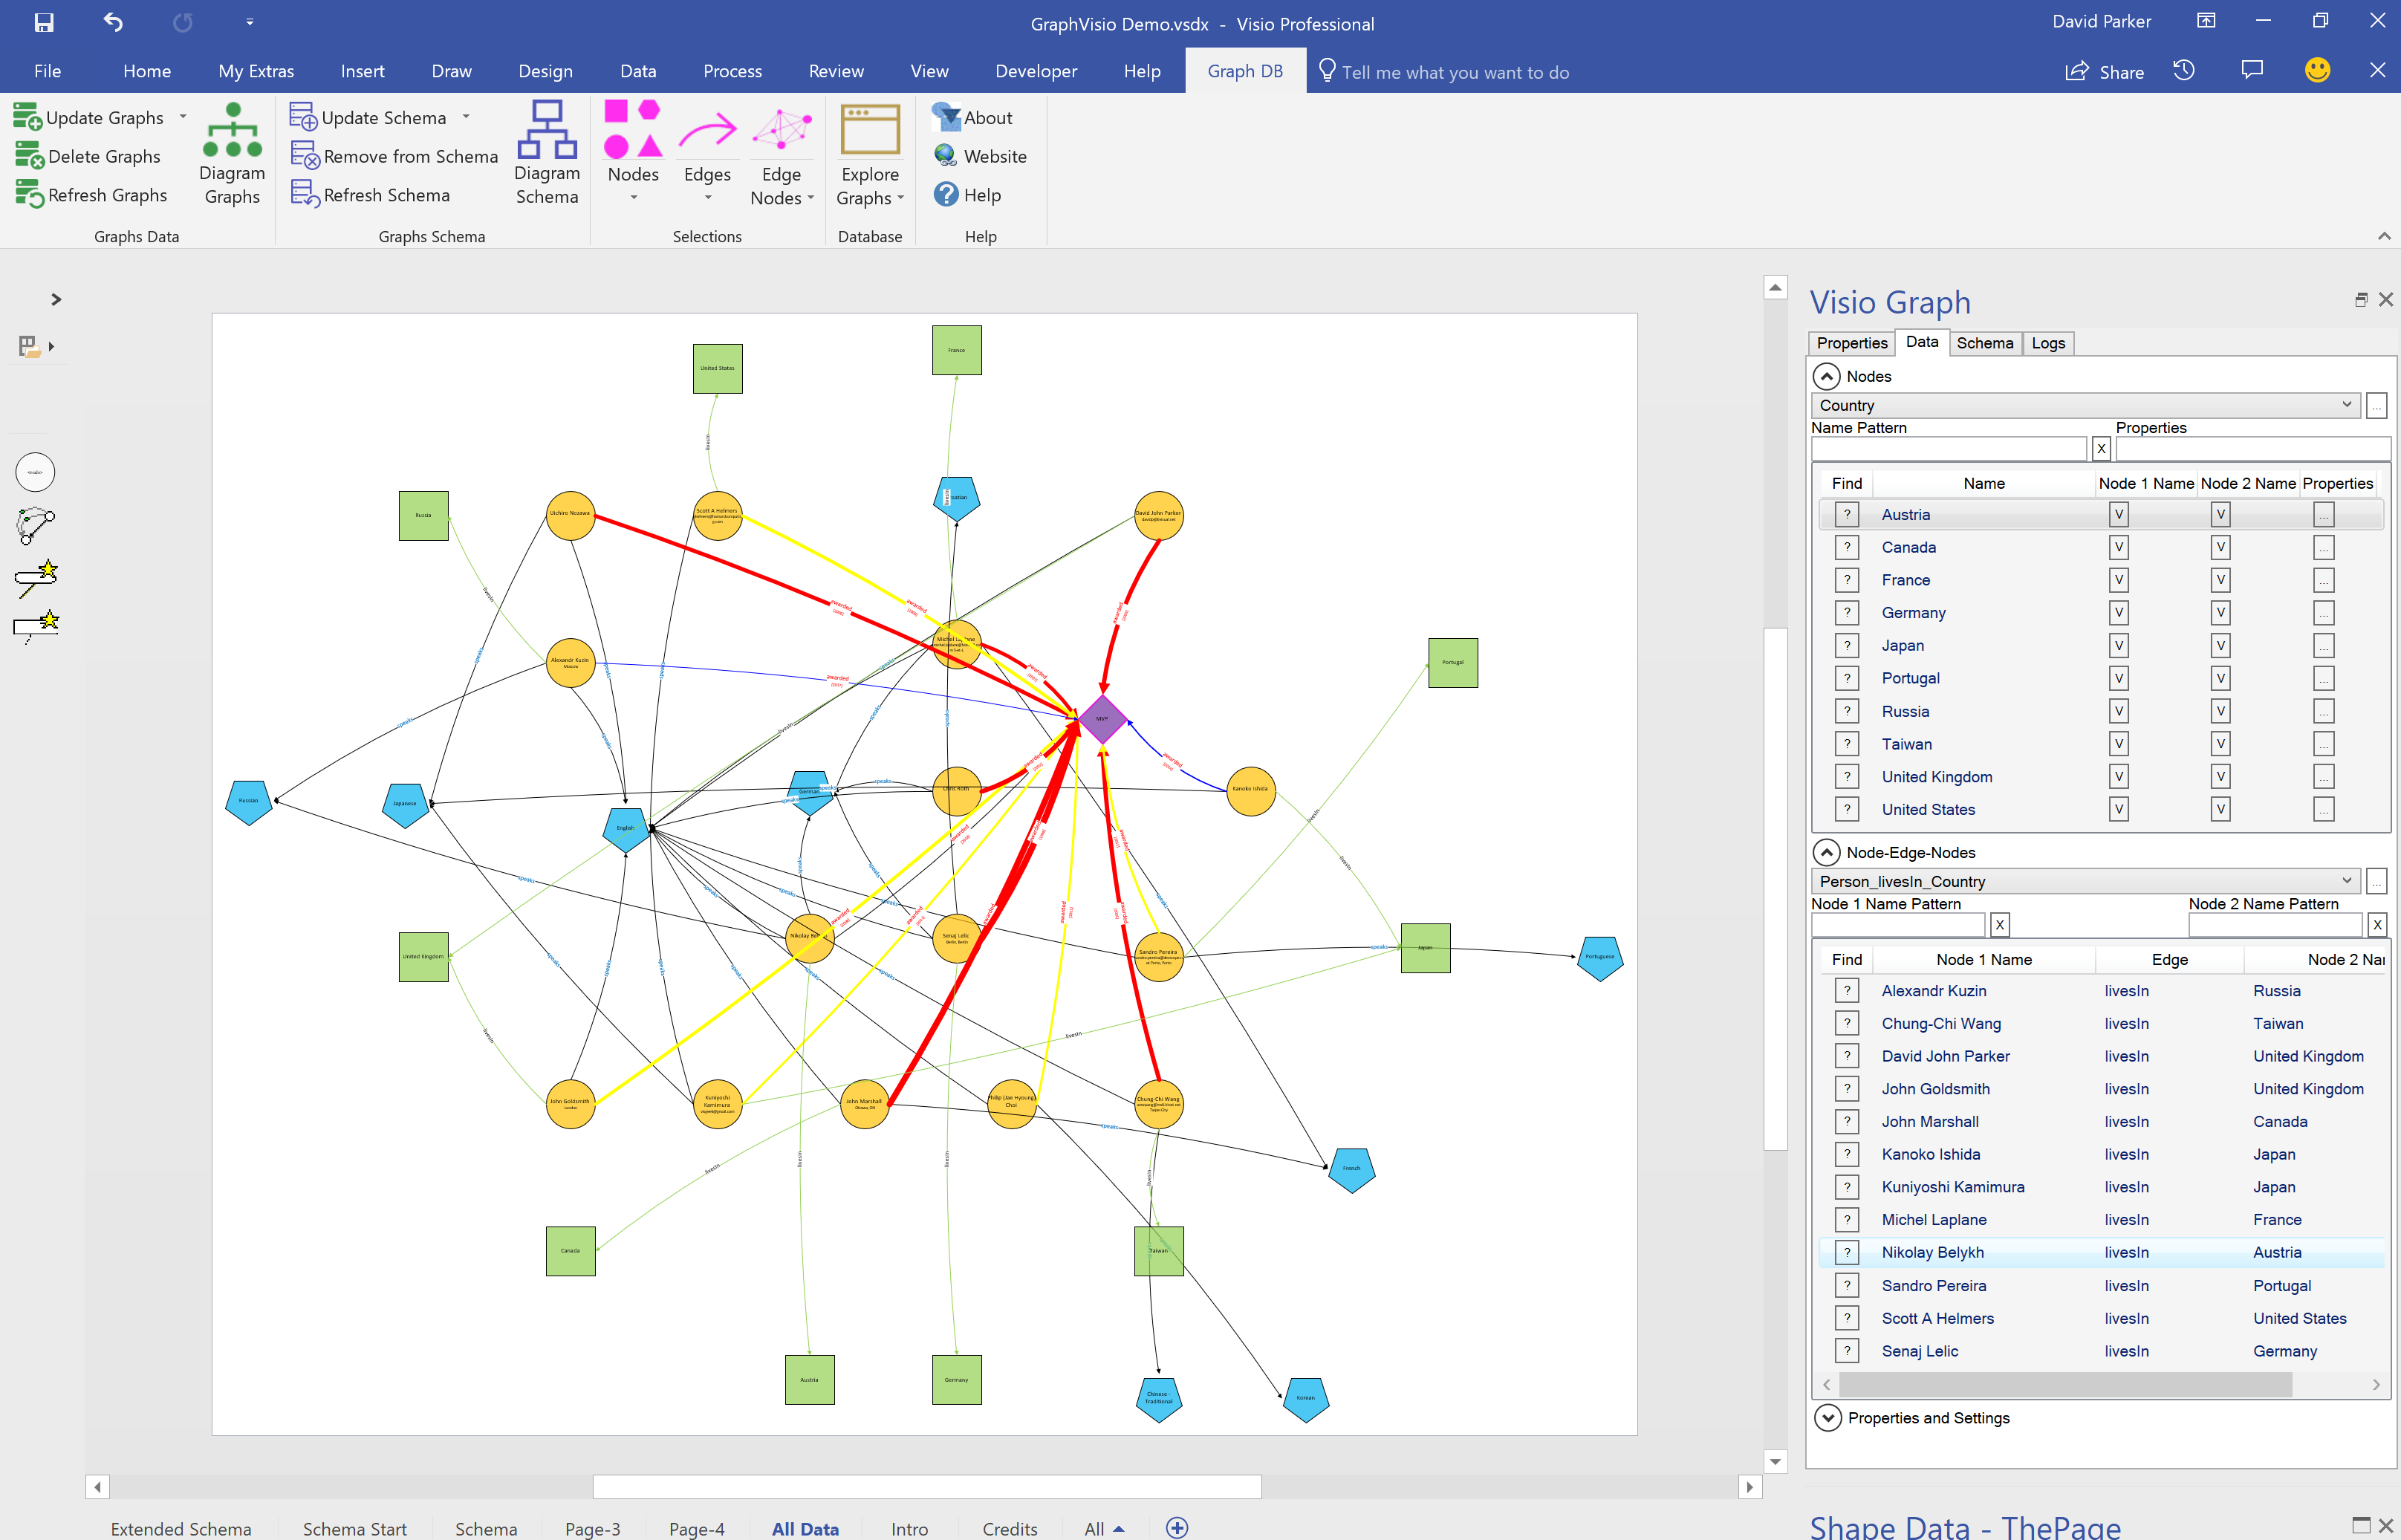
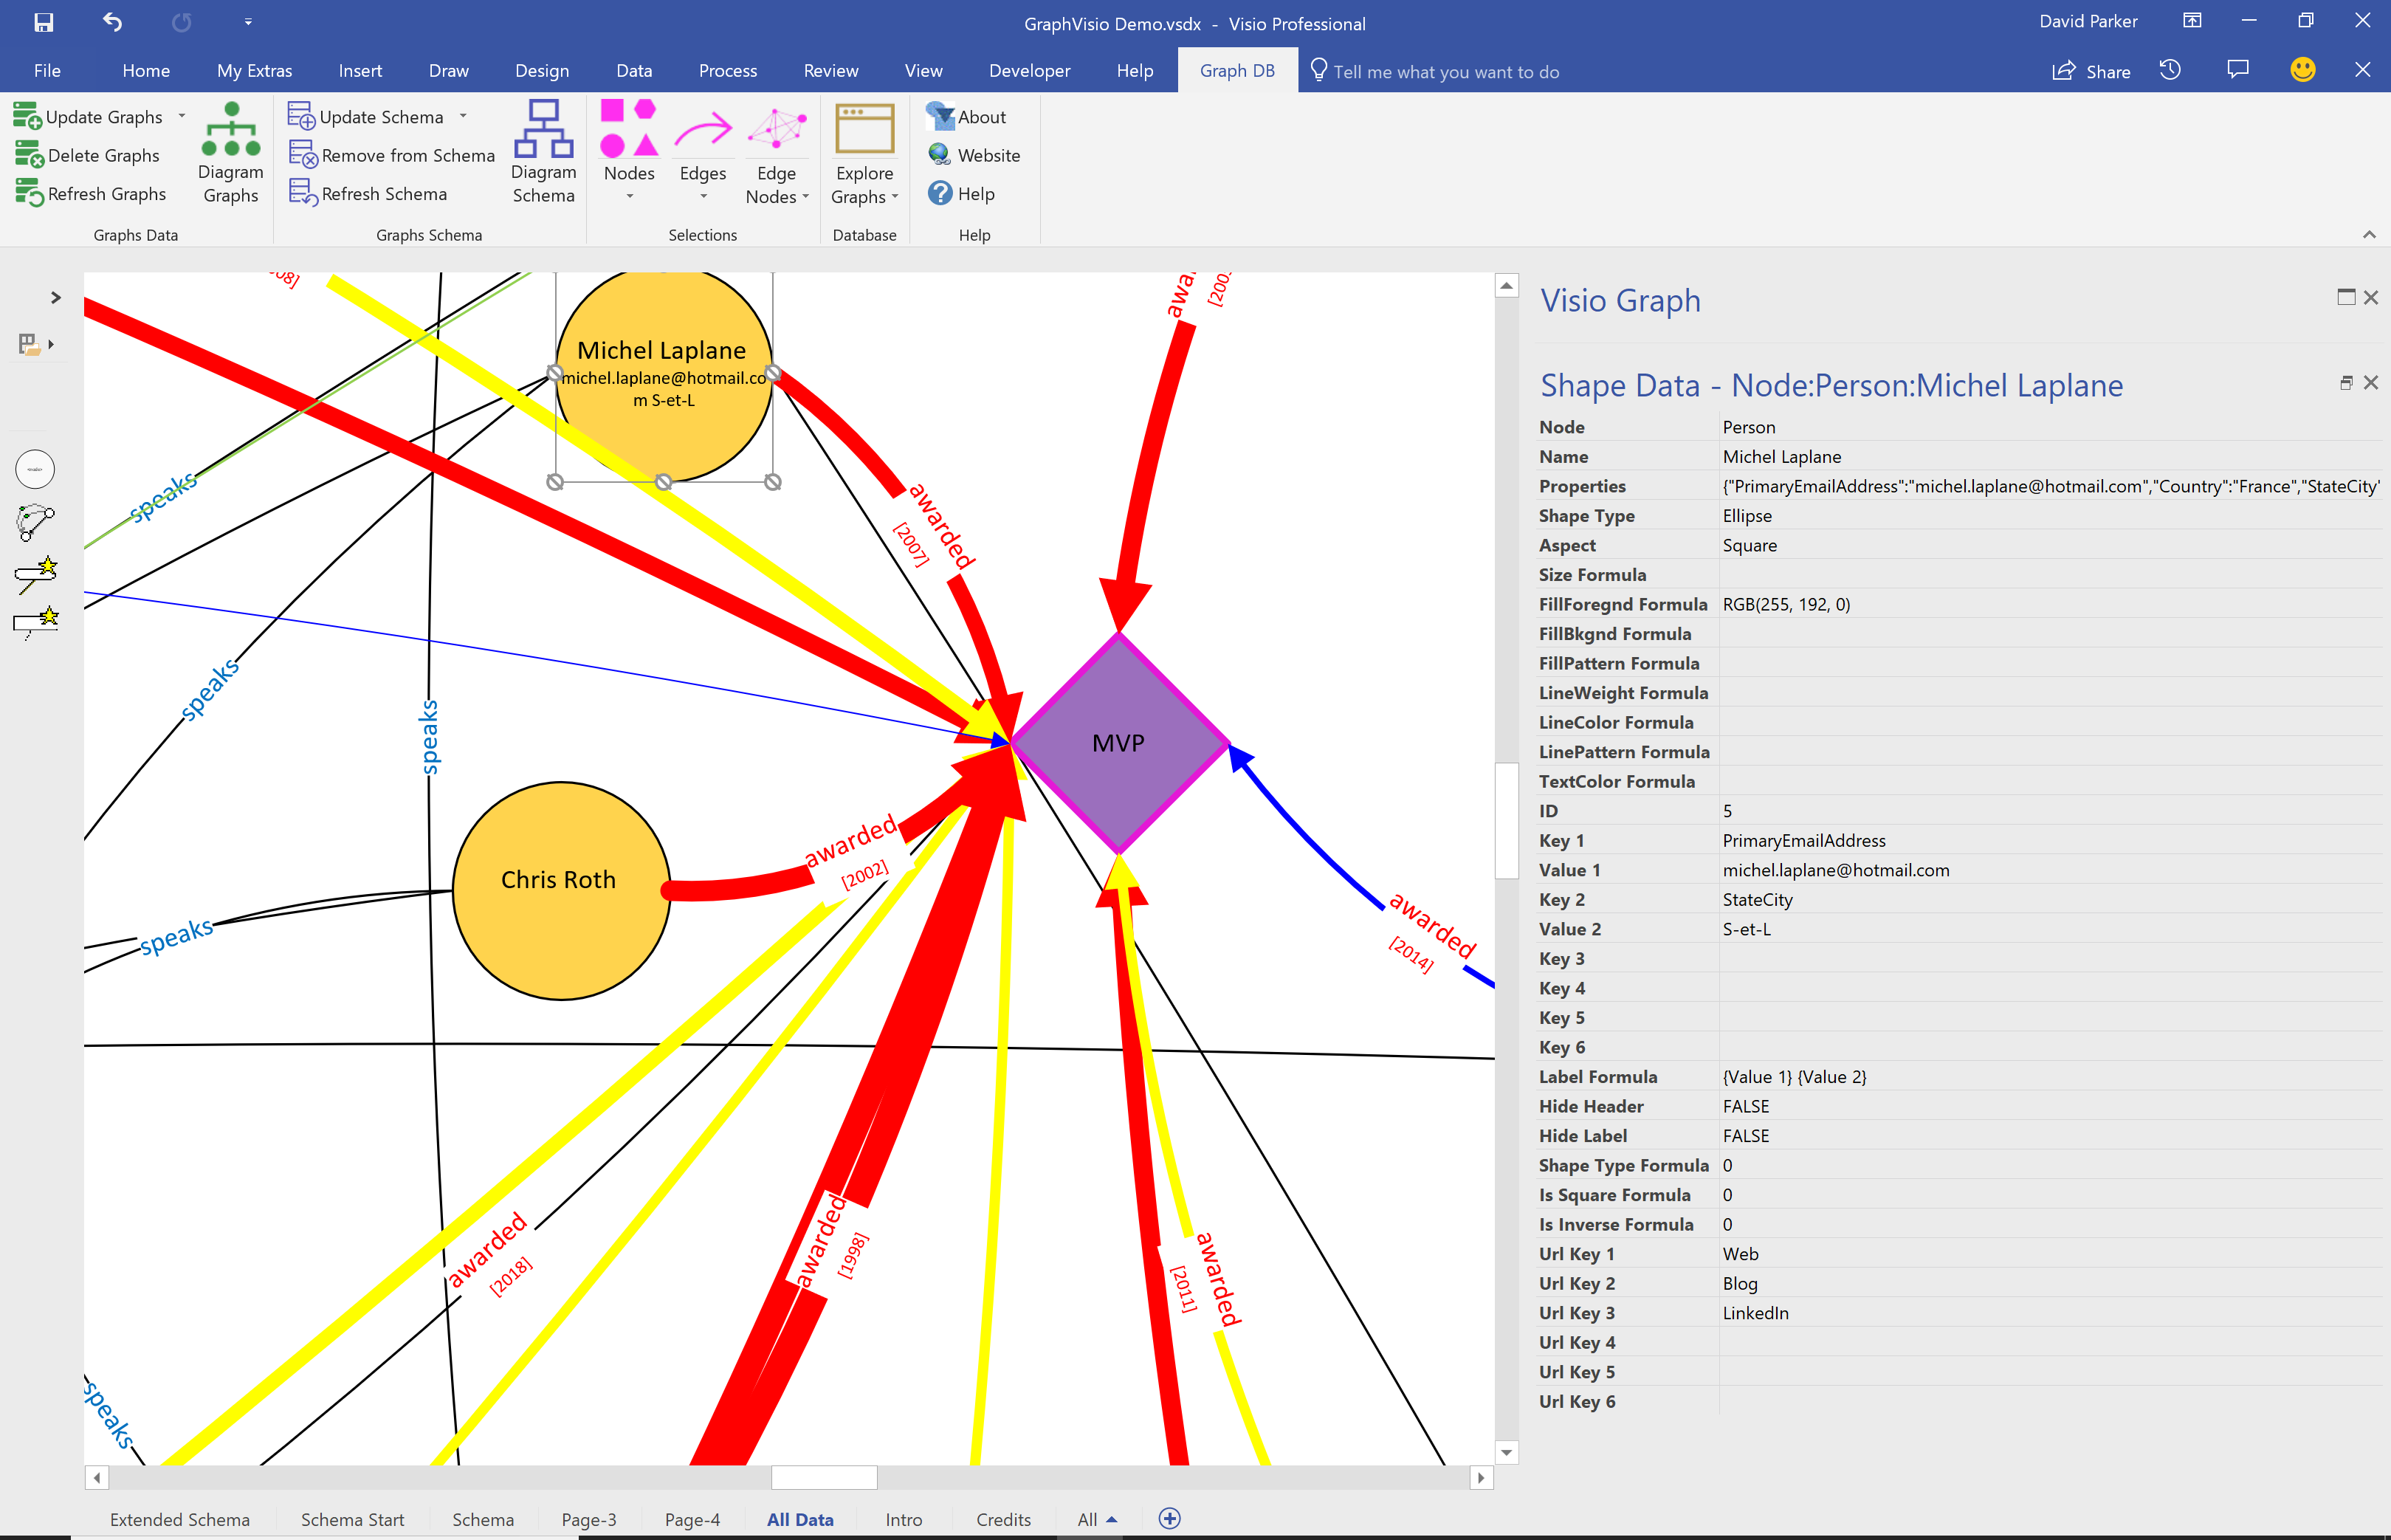
I have been continuing to develop a Visio interface for SQL Server 2017 Graph databases because I believe it will be of great use in many scenarios, such as crime investigations, company and shareholder relationships, and anywhere that defining and illustrating links between items is important.
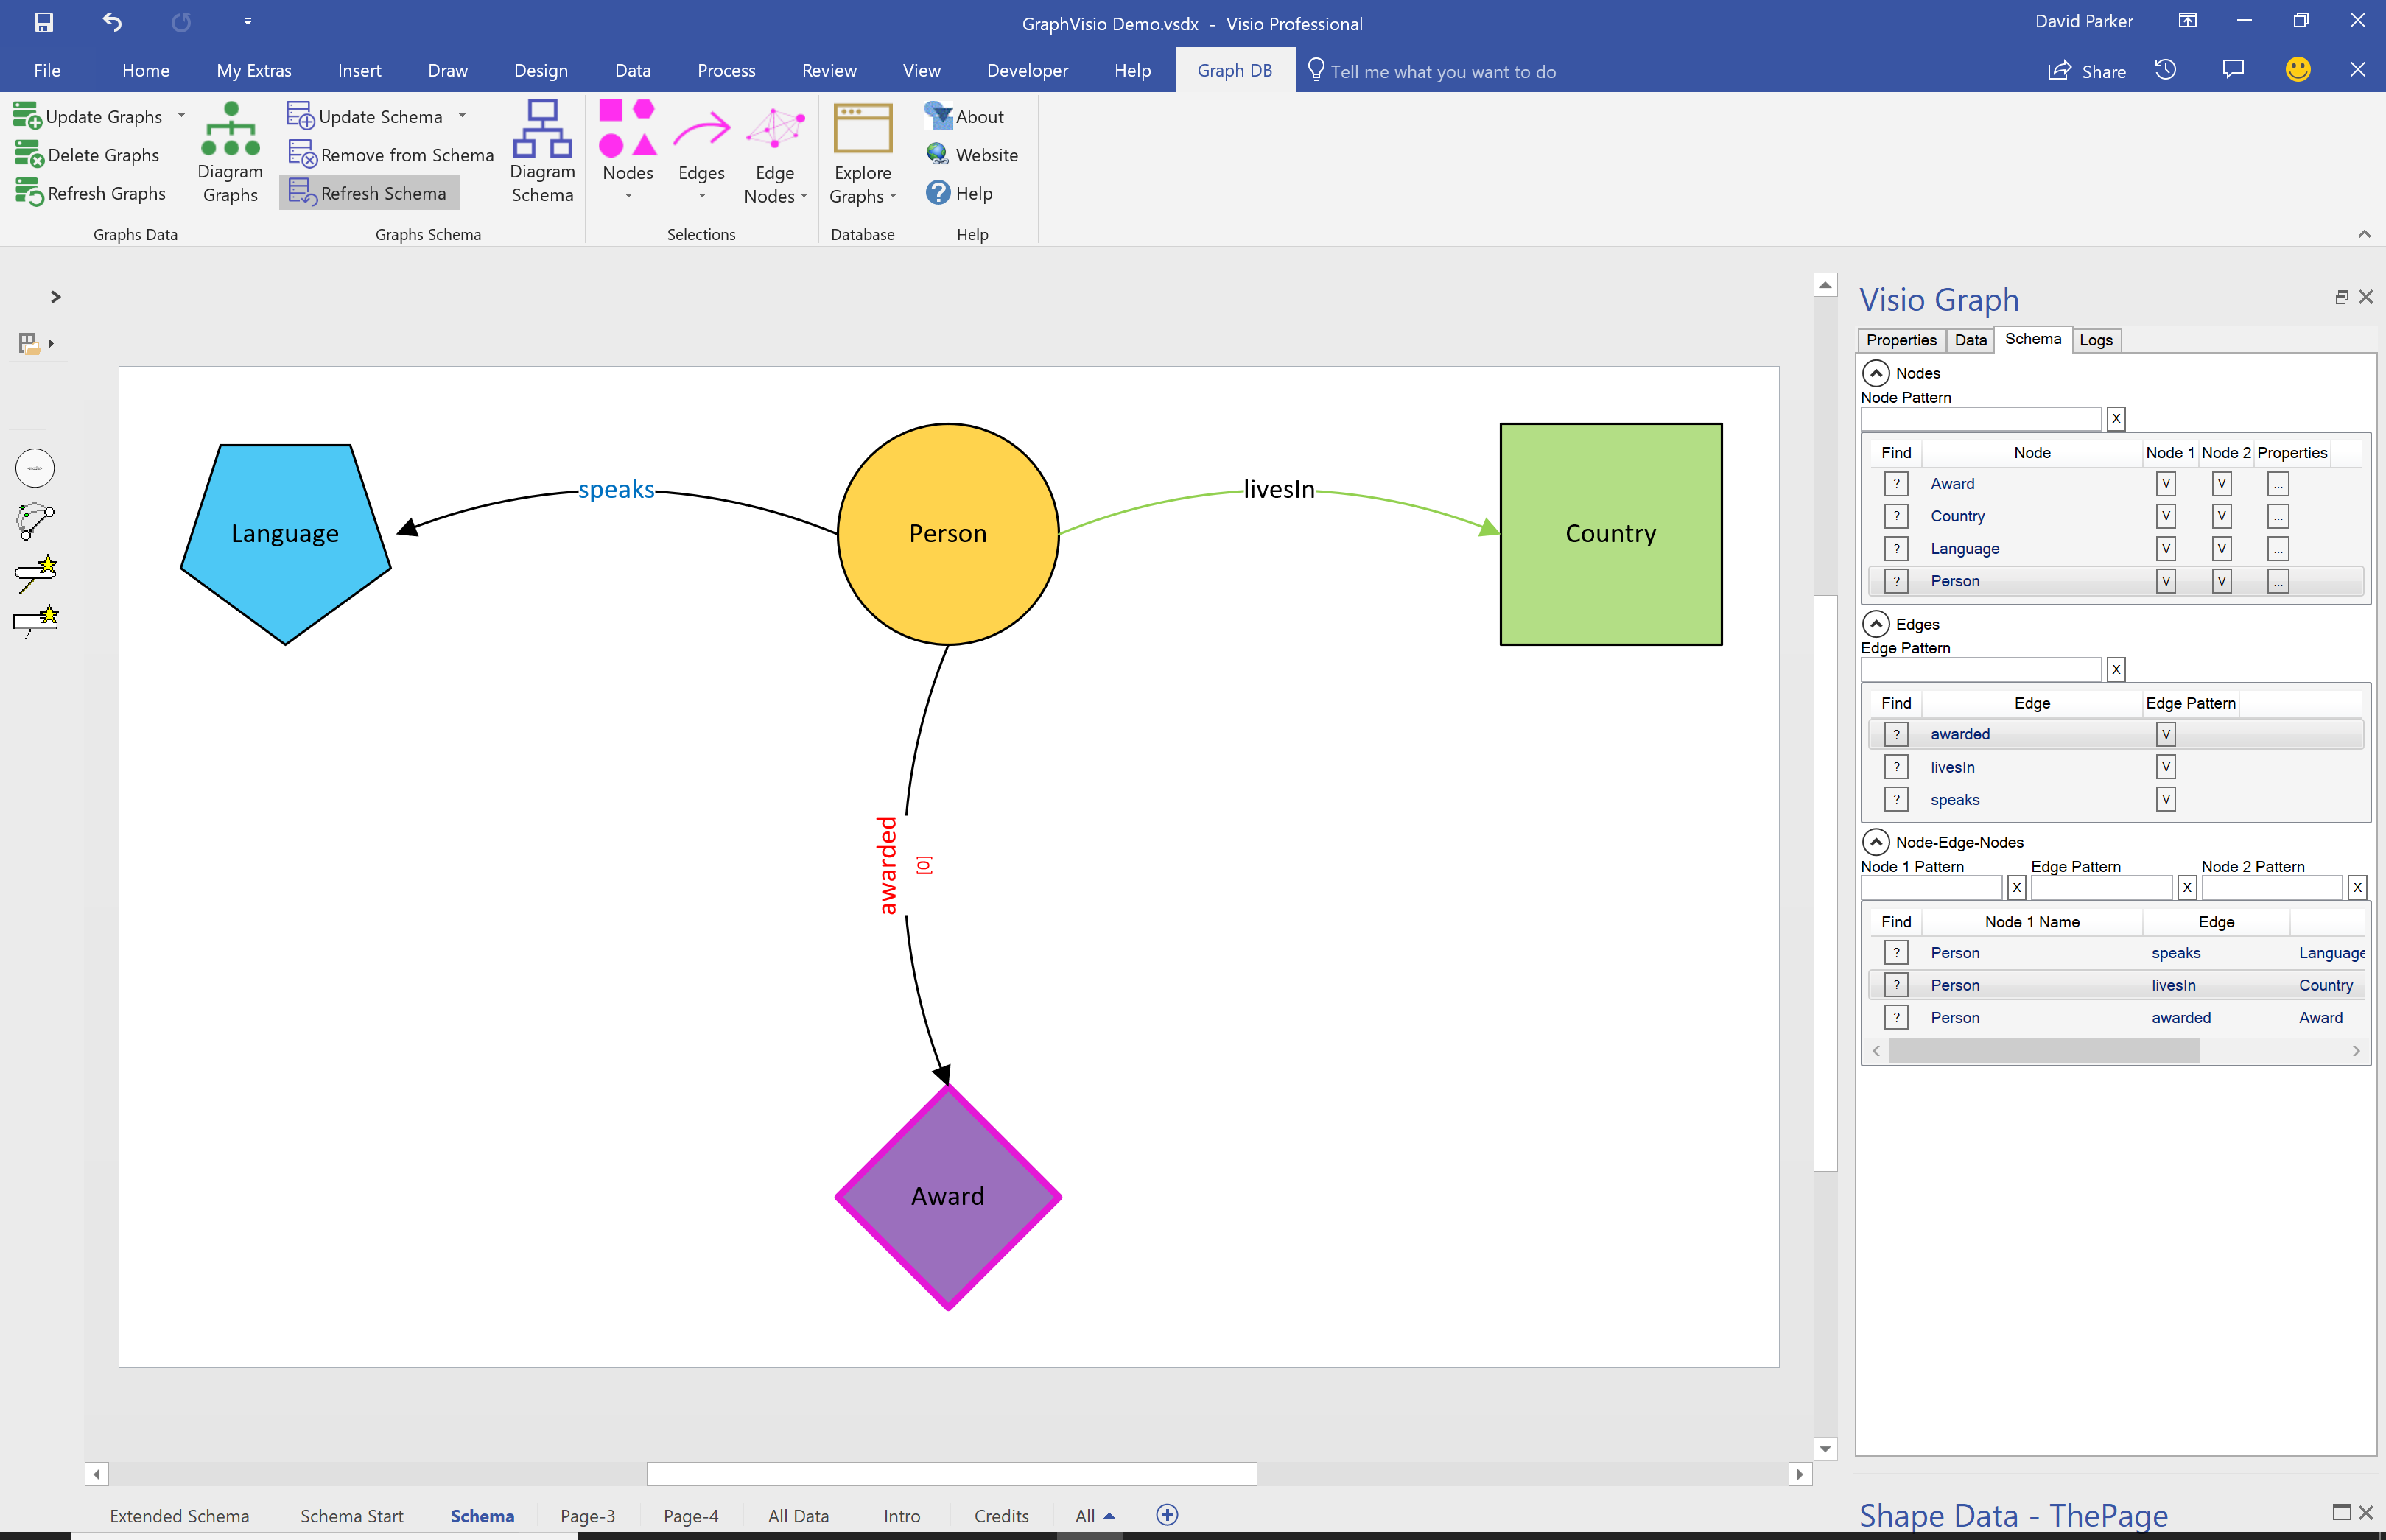
SQL Server 2017 introduced graph tables, Nodes & Edges, which is a great way of storing relationships between objects. However, there is no easy way of creating or visualising this information currently. Visio is a data-diagramming application, so what could be more natural than to use Visio to create and visualise the data?
All Visio shapes can contain data, and are easily connected to each other, so creating meaningful relationships is a breeze. Visio diagrams can be automated too, and this solution is a C# VSTO add-in that enhances the normal Visio interface. The application also has the ability to define the shapes, labels, colours and appearance from the data values, which are stored as Json objects.
An import from Excel is also provided because of its tremendous ability to gather and re-shape data from so many different sources.
The solution automatically creates SQL views of each graph table so that the data can be linked to Visio and used in Power BI too.