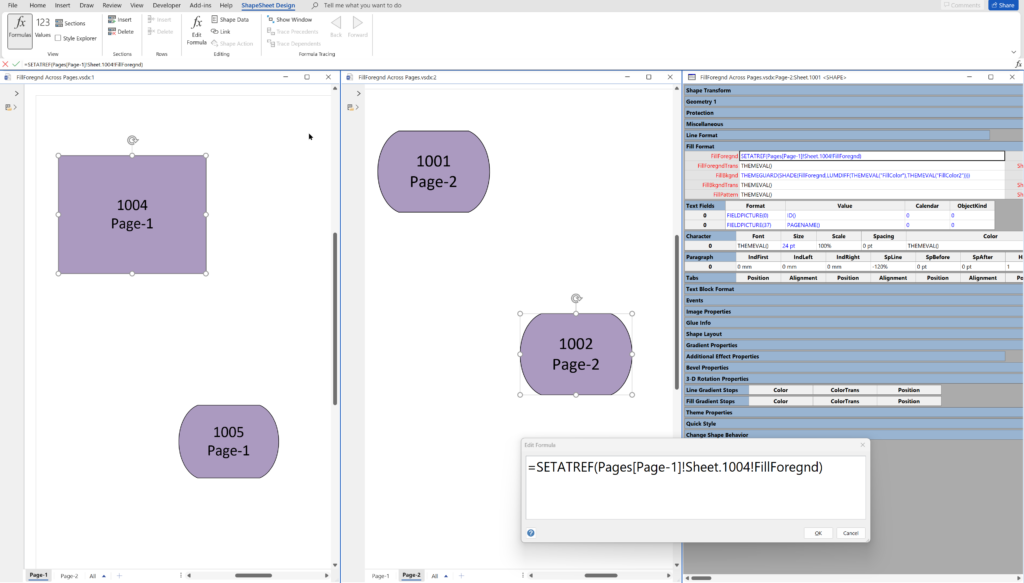
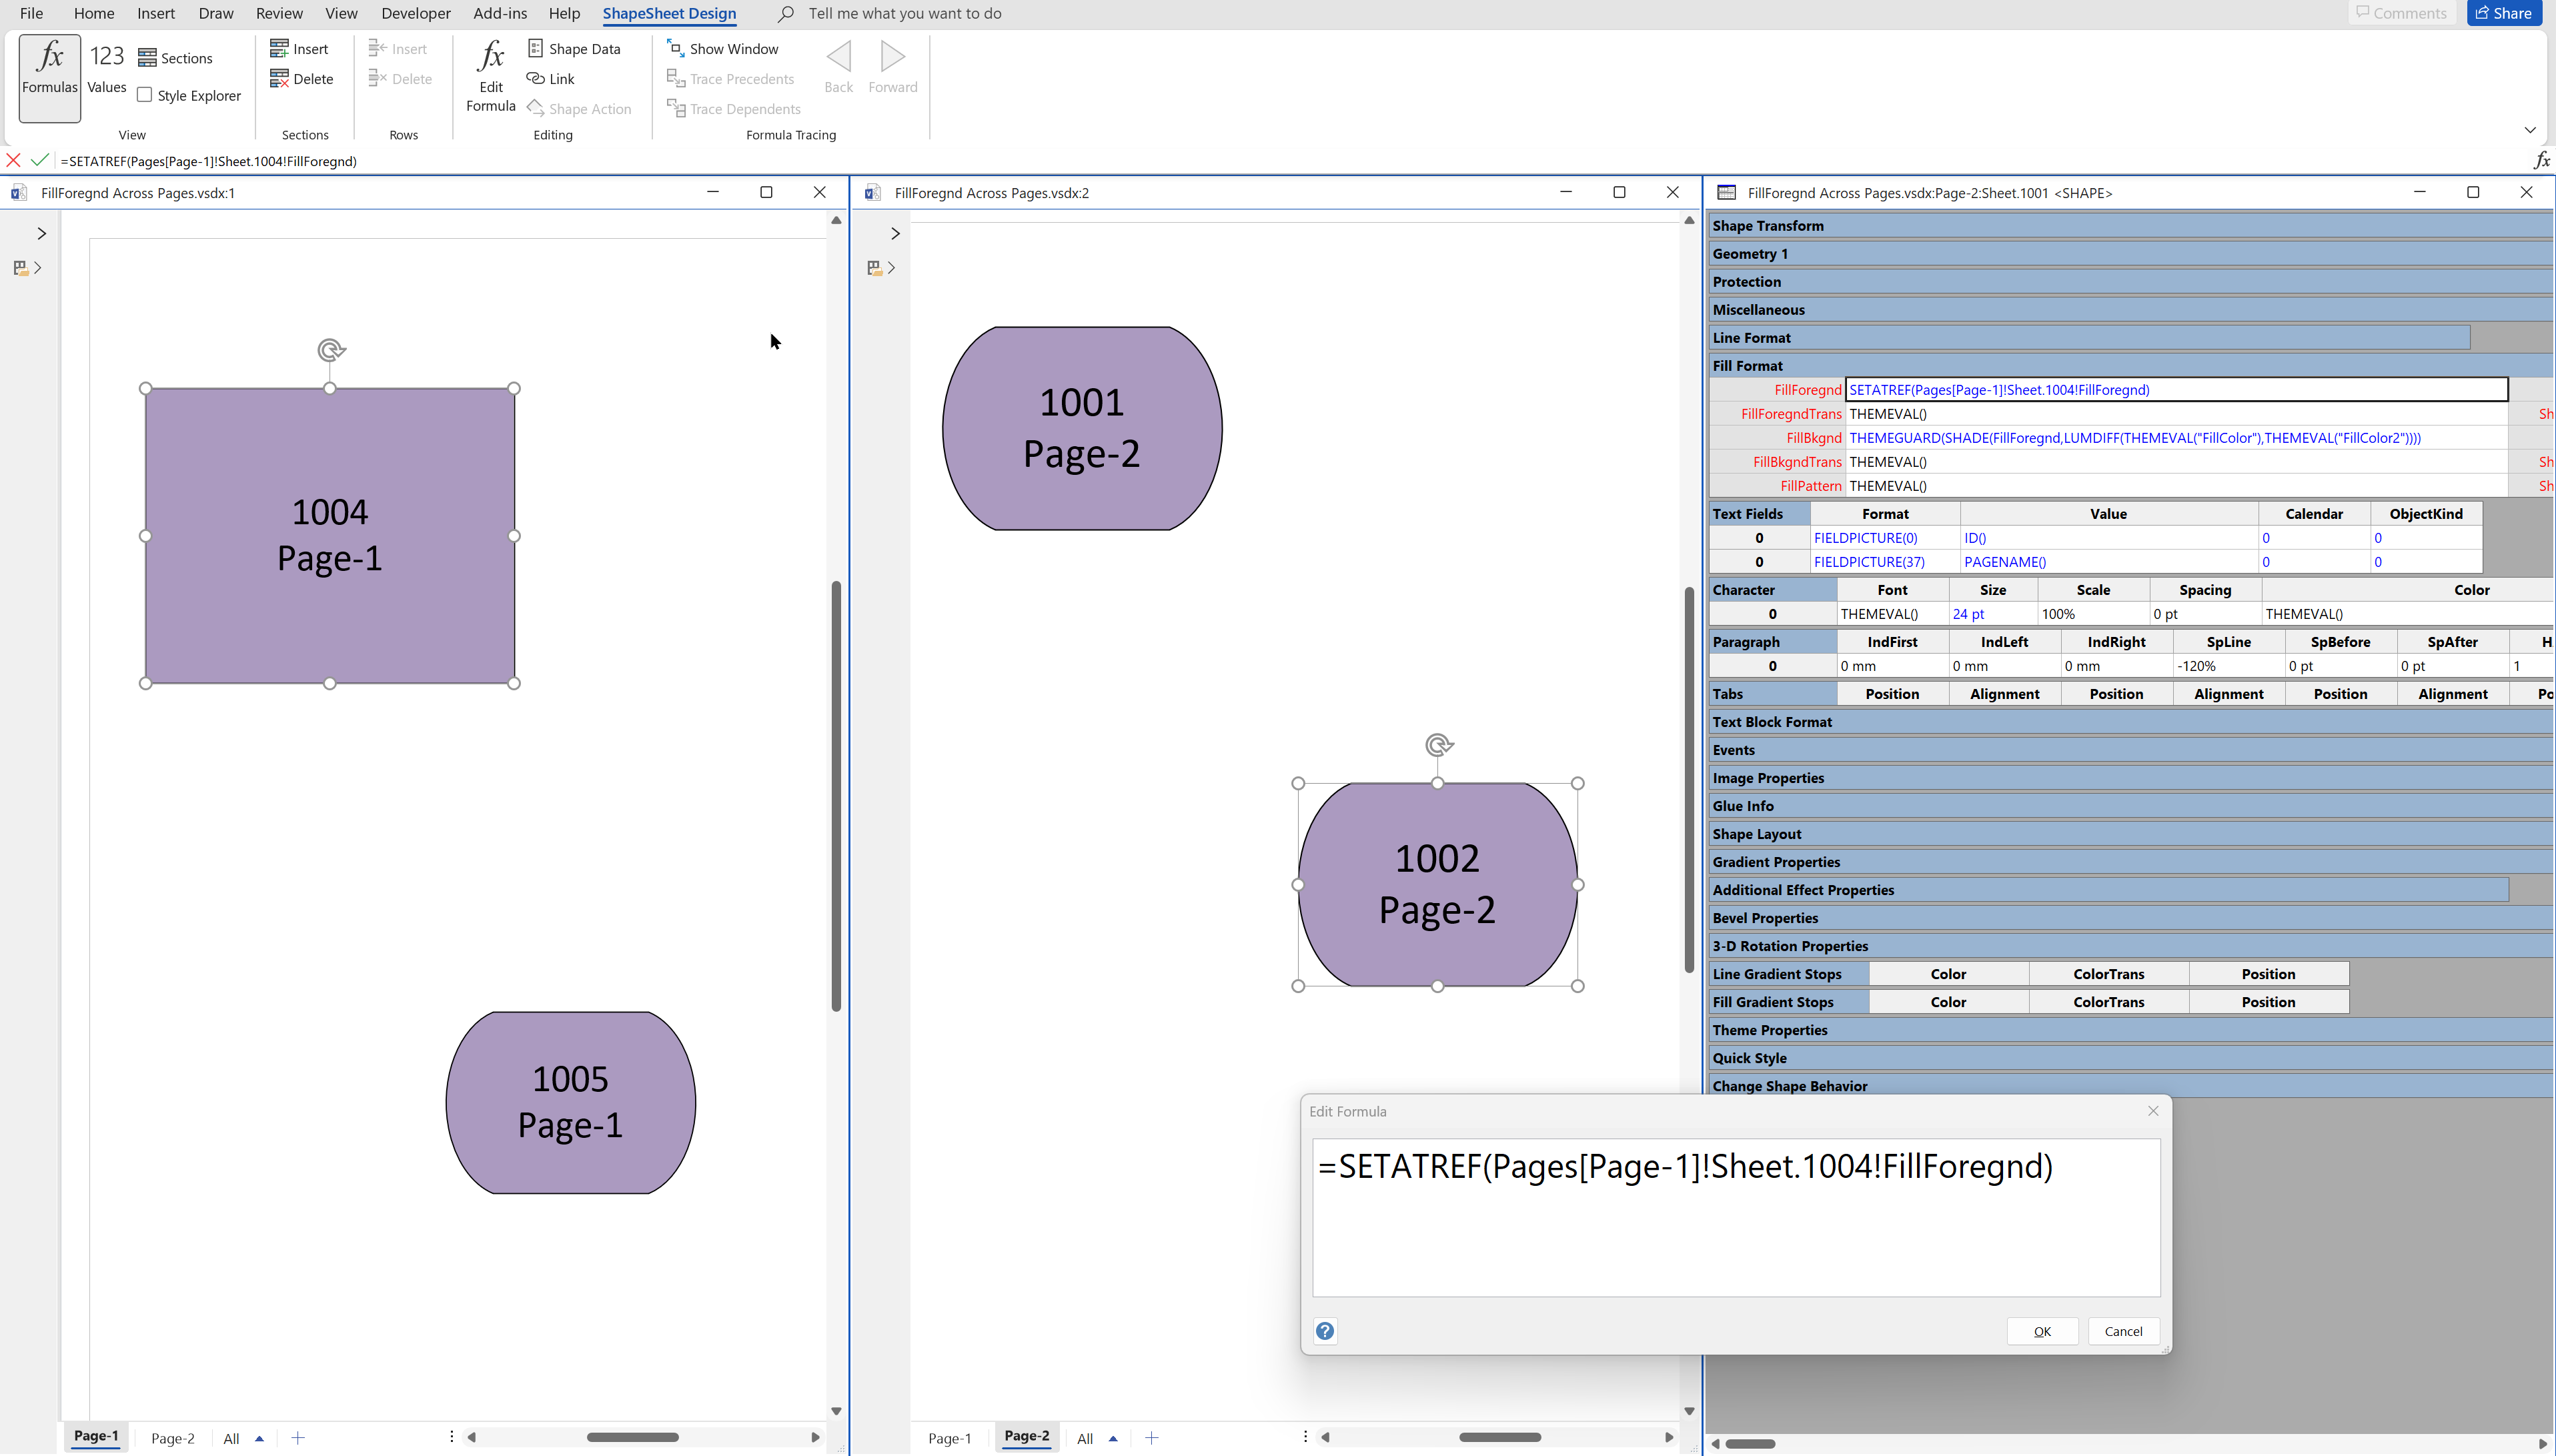
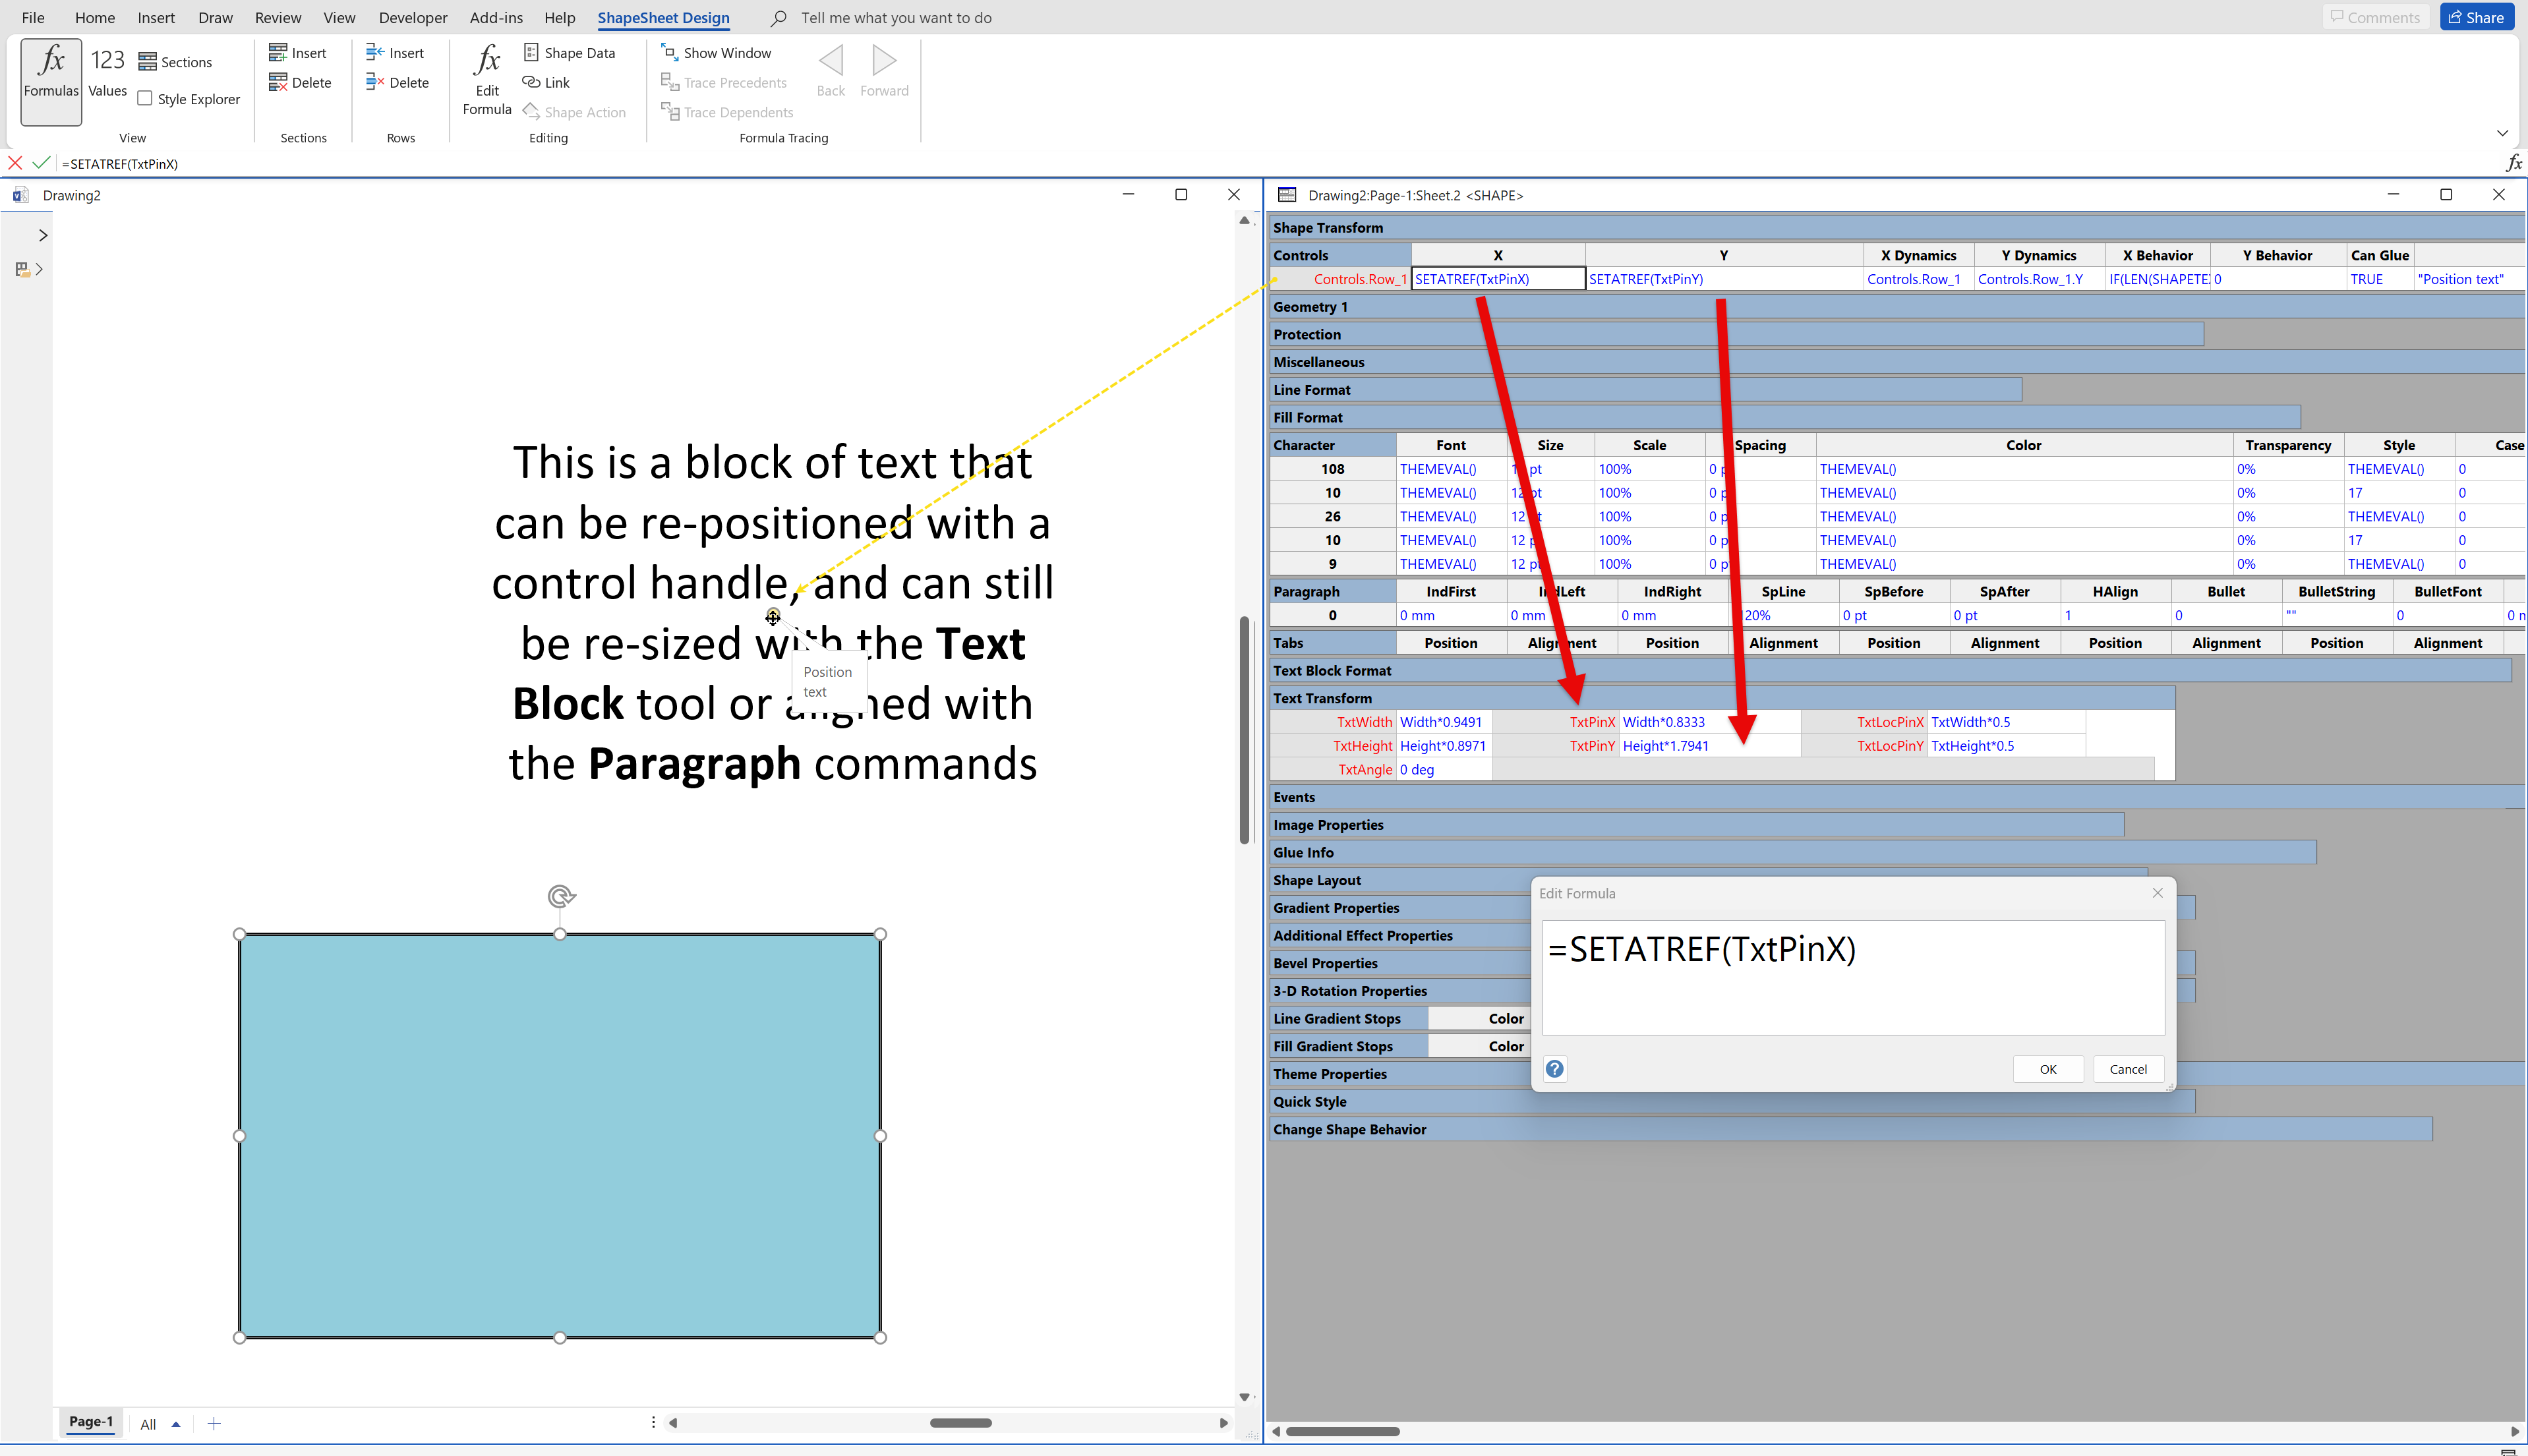
This is the personal blog of David J Parker, Microsoft MVP for Visio, based in the UK.
It contains tips and tricks and sample code for intermediate to advanced Visio users and developers (and a few occasional ramblings about other stuff too).
I am the author of two books about Visio …
Visualizing Information with Microsoft® Office Visio® 2007
http://www.visualizinginformation.com/
Microsoft Visio 2010 : Business Process Diagramming and Validation


September 2, 2011 at 11:01 am
Hi David,
Have you ever created a customised form for entering shape data? For example have Field A then next to it having a checkbox for the validation of the data.
I find the shape data window very non-user friendly when there is a large amount of shape data and the dialog box that it uses is good but it’s main limitation is that it restricts the number of fields.
BTW I’m using Visio 2007
Nick.
September 2, 2011 at 11:28 am
Yes, I have done it with VBA, WinForms and WPF (my favourite) in the past. When talking about validation, then you need to have somewhere to store the constraints … lately I have used an XML file, but if you have a database, then it could come from there.
September 22, 2011 at 7:29 am
Hello David ….
I am Nishant and I am training to become a Business Analyst in Noida , India…
I have been trying to learn about MS-Visio 2010 in my training …Although there are online trainings available for MS-Visio but I want a classroom training in it as I believe a face to face training will help me master it
Can you suggest me what can I do ???
Nishant
Email : nishant202@gmail.com
September 24, 2011 at 7:59 pm
Well, I guess you could call Microsoft in India? http://www.microsoft.com/india/msindia/msindia_ouroffices.aspx
December 23, 2011 at 9:59 am
Hi David,
I would be very grateful if you could point me in the right direction, i am trying to show SCOM 2007 R2 Performace Data such as Memory/CPU usage as a Guage on a Visio Chart. I have no idea on how to accomplish this. any step by step documentation would be useful
thanks in advance
Prakash
January 31, 2012 at 11:57 am
Have you tried
January 31, 2012 at 12:21 pm
Tried what?
January 31, 2012 at 1:33 pm
Microsoft Office Visio 2007 Professional – System Center Operations Manager & System Center Configuration Manager Add-In
http://www.microsoft.com/download/en/details.aspx?displaylang=en&id=16086
February 13, 2012 at 2:42 pm
Hi David,
The original WBS Modeler i’ve read was released with source code. As you were the original author,is it possible to get a copy of your last release? I realise it would be a well outdated version? The current WBS Modeler does not do some things well (formatting, controls on what levels to output) and I was hoping to learn from the old code and go from there.
cheers
James
February 27, 2012 at 9:01 pm
I am using Visio to create flowcharts that I would like to publish as part of my company’s product documentation on the web. I have tried the Save As > Web page function and the flowcharts, which are on larger-than-normal-sized sheets, are zoomed out to the point where shape text is just squiggly lines. The links, etc., work fine, but users will have no idea what the shapes are pointing to.
Any tips on how to publish large diagrams to the web and still have readable text on them?
Thanks for your help!
February 29, 2012 at 8:16 am
Do you publish in VML (if using MS IE) or XAML ?
If so, you should be able to zoom in on the items.
Any other format is going to pixelate and become unreadable.
Another tip is to use the User.visEquivTitle cell to create a tooltip for the shapes. see
September 25, 2012 at 11:30 pm
I cannot get the user.visequivtitle cell to show a tooltip in 2010 when viewed in SharePoint. Insert tooltip works in visio, hyperlinks work thru to SP.
September 26, 2012 at 2:20 pm
I assume that you mean with the Visio Web Access control?
Well, that is using Silverlight to display the Visio documnet, so it doesn’t understand User.visEquivTitle, whih was introduced for html.
September 26, 2012 at 2:22 pm
I should have added that, with the Visio Web Access control, you can use JavaScript to display whatever you want from the Shape Data values anyway … so it can be far better than just relying on User.visEquivTitle
March 10, 2012 at 12:27 am
David,
I’m a grad student in Jamaica trying to show a historical timeline with dates pre 1899 (my research covers 1800-2009). This rules out using Visio’s timeline based on the dates it will accept. I want to show events for 5-6 thematic areas. Some have no duration, others have durations. I thought about getting the event data displayed in shapes that were spread out based on date.
I have the information in a excel file. Based on the number of rows of data 209 and the number of thematic areas I need to automate this. I know I need to link shapes to data or use the database wizard to make the two programmes talk. But then there are a couple of other things I would like to do – colour the shapes by theme, have the different themes running at different heights and the MAIN THING, have the shapes arrayed by date. Display width is not an issue, this does not have to fit on letter size paper, but could fit on say a 11 X 36 roll out.
Can you give me some guidance on how to proceed?
Thanks
March 12, 2012 at 8:13 am
The minimum date of 1/1/1900 is shared across all Office apps, so it is not just a Visio issue. I have some thoughts about how you can achive other dates, and use Link Data to Shapes, so I’ll prepare a post and come back here in the next couple of days.
March 13, 2012 at 10:30 pm
I look forward to your forthcoming post.
March 13, 2012 at 10:28 pm
Thanks for responding. I look forward to your forthcoming post
THE
March 16, 2012 at 4:22 pm
And here it is : http://davidjpp.wordpress.com/2012/03/16/making-timelines-with-dates-earlier-than-1900-in-visio/
March 13, 2012 at 10:29 pm
Thanks for responding. I look forward to your forthcoming post
March 17, 2012 at 2:39 pm
Great Post – answered all aspects of my query. Thanks. The download files are a fabulous bonus..
May 3, 2012 at 8:51 pm
I just purchased your Visio 2007 book…The book is great, however the companion website to download the code is terrible! I have never had to go through so much to download sample code! At least give an option to download all chapters at one time instead of individually.
May 4, 2012 at 1:03 pm
David P., Thanks for the quick response… and all the files!
May 4, 2012 at 1:41 pm
Enjoy learning Visio, and I will supply a download link to all those who contact me and have purchased my book.
May 9, 2012 at 9:39 pm
I am trying to add some fields to the qorg chart master shapes…I have deleted all the shape data from the master shapes…then I add the new fields that I needed. If I open the modified master shapes the shape data fields are correct, but when I add them to a drawing there are 2 new shape data fields…Name and Title? Are these required for an org chart so visio adds them if they are not present?
May 9, 2012 at 10:12 pm
They are the default properties referenced in the Display Options / Fields. Try unticking them.
May 31, 2012 at 2:48 pm
The images for “Linking Visio WBS Modeler Diagrams to Project” don’t seem to work. Is it something on my end or yours?
June 3, 2012 at 3:28 pm
The images seem to work for me.
July 2, 2012 at 8:38 pm
Hello,
I am working with the WBS Modeler Add-On with Visio Professional 2010 and I’m using a fairly large WBS. However, the add-on does not include the option of aligning the child elements vertically. Is this an option that was left out because it seems like a very useful tool to more easily represent the data. If you have any insight on this issue, please get back to me. Thank you
July 2, 2012 at 10:45 pm
Dan,
What can I say? There was an option to align the child elements vertically when I wrote it, but it seems that Microsoft have “simplified” it!
By the way, have you seen the following article ?
http://jeremycottino.blogspot.co.uk/2012/06/creating-work-breakdown-structure-in.html
July 3, 2012 at 12:48 pm
Dave,
Thank you for your response. I had not read the article and messaged Jeremy if he knew of any kind of alternative. In addition, do you know any other program/add-in that performs similar functions as the modeler? (eg. going from MSProject and vice versa to creat a WBS)
October 19, 2012 at 9:51 am
Hi David,
I wrote an Visio 2010 Add-In which convert some process diagram-files into another process diagram-files. It just iterates through every file and create paralell file which contains “my” process shapes. Everithing looks fine, but discovering the shapes which I drop in swimlanes I realize, that only the shapes from the FIRST source file are members of container in the FIRST target file. Then, for the next files 2,3,…n all shapes are correctly positioned, but they aren’t members of the respective containers. When I change the source file names, then again, only the containermembers for the first created file are really container members(shape.MemberOfContainers). In your last book, I couldn’t find solution for this problem(maybe I’m too lazy to read patiently/carefully). I think that it’s could be something with the file.close() order, bur I’not sure.
October 19, 2012 at 1:47 pm
I think that you may not have used the shape.AddToContainers method?
October 19, 2012 at 3:07 pm
Yes
that was it. Yet I use shape.AddToContainers after every shape.Drop
Very strange, for the first processed file I also didn’t use it and the shapes of the first created file are containermembers
Thank you!
January 11, 2013 at 4:57 pm
Hi David,
I am building an orgchart with about 1500 employees and am spreading it across about 50 pages. I’m using vb.net (visio Interop) and a DB to build the chart using a custom stencil. I can add the shapes to the correct page along with the shape data fields and connect the shapes correctly…my issue is trying to figure out how to arrange the shapes on the page so that all shapes fit and it looks presentable without human intervention.
In my DB I have fields that are used to configure what page each person should be placed on as well as the org structure, so that part is configurable if I have to many shapes on a page I can move people to a different page very easily.
Am I on the right track or is there a better approach?
Thanks for any suggestions you can offer!
January 17, 2013 at 2:08 pm
Again I have a question and I think you are the one who can help me. I want to edit the Microsoft swimlane master shape(cross-functional flowchart) so that when I drag it into the page no Title or Separator are visualized. Only Swimlanes should be visible on the Page. I could uncheck “Show Title Bar” and “Show Separators” later, but that is unsatisfactory for me. I tried to completely delete the ShapeSheet Row User.visMasterStencil: “xfunc_m.vss”, but then usefull functionality get lost.
Can you suggest me a solution for this problem?